2025 Private Equity Real Estate Outlook – Opportunity in Niche Investments Amid Resetting Valuations
February 2025
OPPORTUNITY IN NICHE INVESTMENTS AMID RESETTING VALUATIONS
2025 PRIVATE EQUITY REAL ESTATE OUTLOOK
Our 2025 Macro Outlook highlighted the uncertainty clouding the investment landscape in the coming year. However, even within this context, as investors across the private equity real estate market, we see bright spots ahead, particularly in:
- Select niche subsectors that provide critical housing and service needs to communities
- Improving capital flows into private equity real estate
- A continued valuation reset offering a historically beneficial entry point for investment
Opportunities in niche subsectors
The multifamily, industrial, retail, and office sectors have all gone through phases of favorability with investors and experienced their own challenges, whether vulnerability to oversupply driven by consensus amongst investors (i.e., multifamily and industrial) or technological disruptions that fundamentally change the way we utilize the spaces (i.e., retail and office). However, within each of these major asset classes there are niche subsectors that behave differently because they 1) lack institutionalization, creating more attractive pricing and a lack of over-supply, and 2) provide essential services that are core to society, driving strong real estate fundamentals (in the form of occupancy and rent growth). We believe these niche subsectors will present compelling investment opportunities in 2025.
Service Industrial
While fundamentals across the overall industrial sector have deteriorated as a pause in demand, coupled with supply pressures, has halted rent growth nationally and sent vacancy to levels not seen in years, not all industrial is created equal.
Service industrial consists of small-bay assets less than 120 feet deep with 12- to 24-foot clear heights, predominantly grade-level loading, and average suite sizes below 10,000 square feet with less than 30% office finishes. These spaces are tailored toward service-oriented businesses focused on local populations, making the ideal service industrial location in infill, densely populated, or rapidly growing areas. Here, as these assets are converted into higher and better uses, negative supply is resulting in low vacancy–at just 2.1% to close out the year in 2024¹–far below that of the overall industrial sector at 6%, per data from CBRE.

Additionally, this niche subsector has not yet been institutionalized in earnest, resulting in going-in cap rates that are still at reasonable levels in today’s interest rate environment. Plus, the lack of institutional operations generally creates a large mark-to-market opportunity. Short lease terms, strong fundamentals, and frictional market vacancy allow investors not only to capture the existing mark-to-market but also provide a runway for additional market rent growth, generating attractive yields on cost within 24-36 months of ownership (Figure 1).
Figure 1: Yield on cost based on average deal characteristics
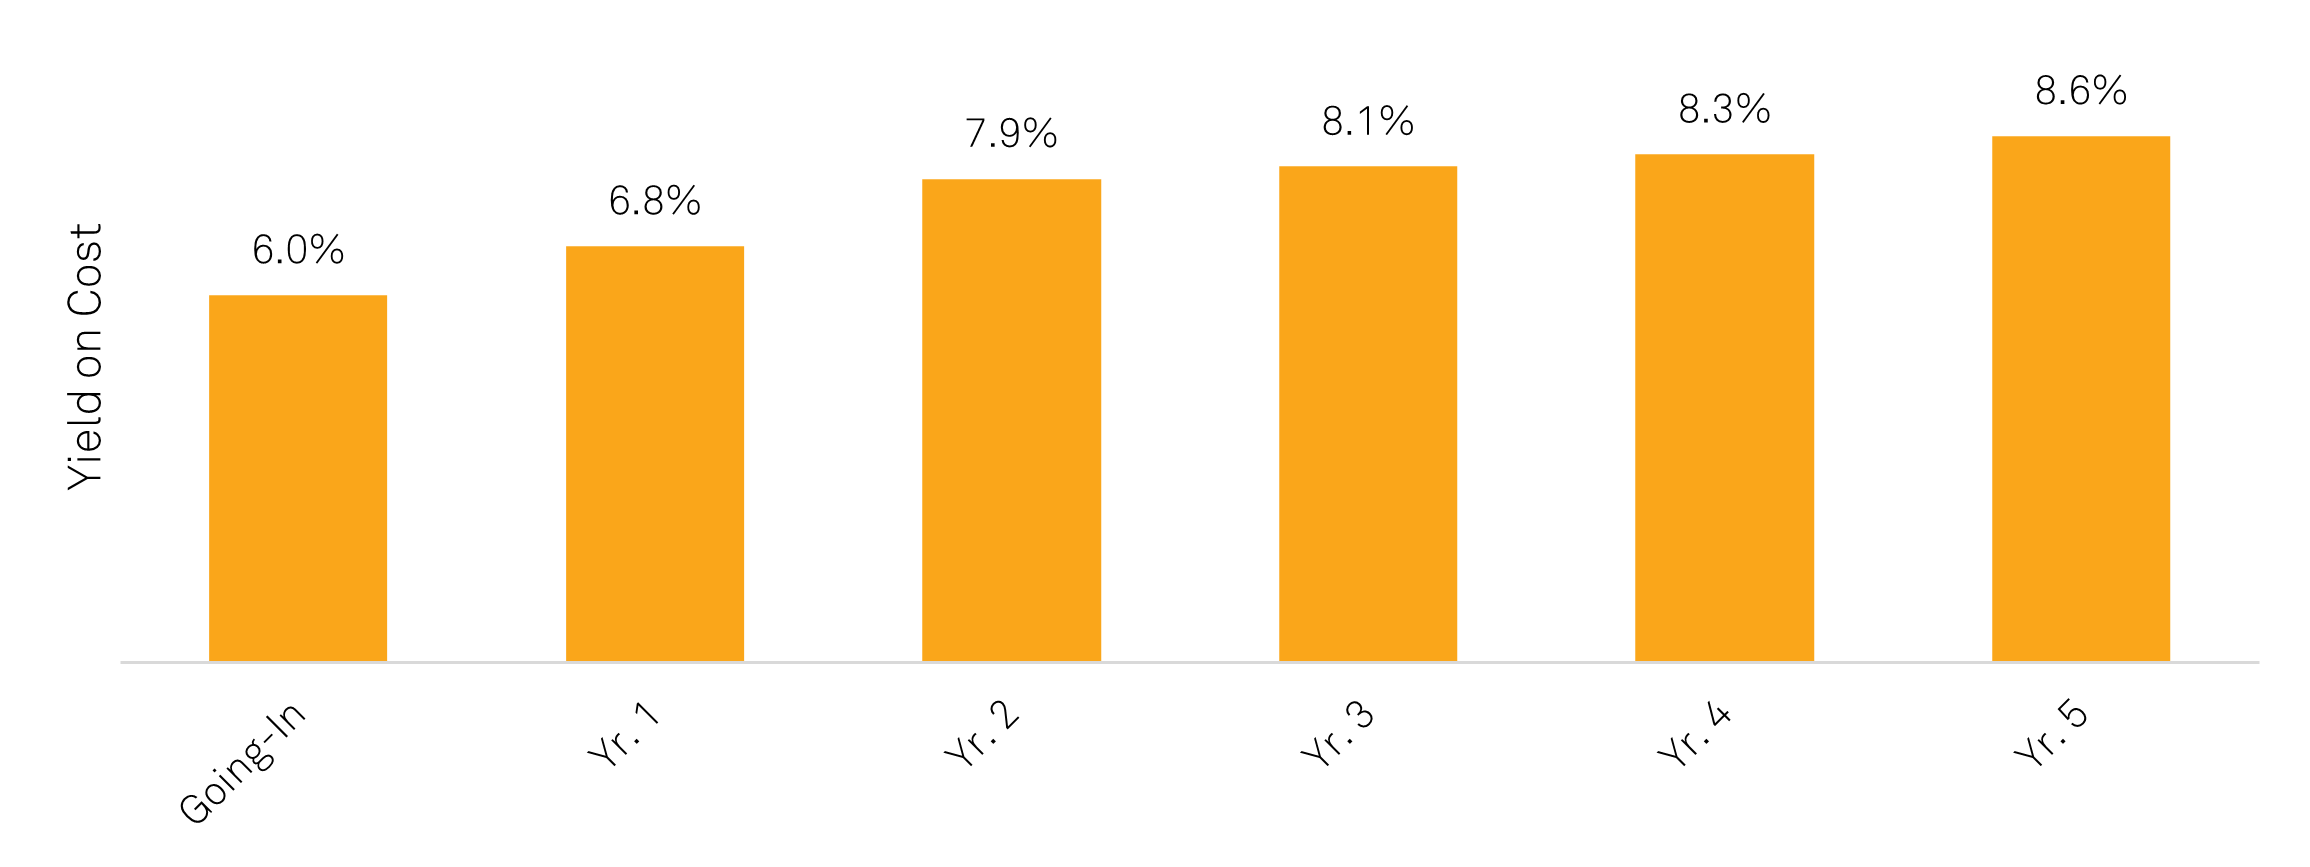
Sources: CenterSquare, as of December 31, 2024. Based on typical transaction: going-in cap rates range from 5.5%-6.5%, existing leases 30-60% under market rents, weighted average lease term under two years, 4% annual escalators, and 3% rent growth.
Purpose-Built Rental Communities
Despite the supply in rental housing in the last few quarters, home ownership affordability remains a critical issue. Mortgage rates are near 7%, home prices remain elevated, and maintenance and insurance costs have risen dramatically across most markets. Altogether, since 2020, mortgage payments have increased 88% while incomes have only increased 17%², exacerbating affordability concerns. Meanwhile, the demand for suburban lifestyles and single-family living continues to rise (Figure 2), driven by the confluence of several factors. The millennial generation is aging into family formation years and needs more space and strong public schools for growing families. Further, increased hybrid and remote work arrangements allow individuals to live further from the city center as commutes become limited to a few days a week. The real estate industry’s solution to this has been the rise of institutional single-family rentals. While many large institutional platforms have embraced the scattered site model of purchasing disparate homes, we are focused on a niche within the space – Purpose-Built Rental Communities (PBRC).
Figure 2: Annual population growth in primary cities and suburbs
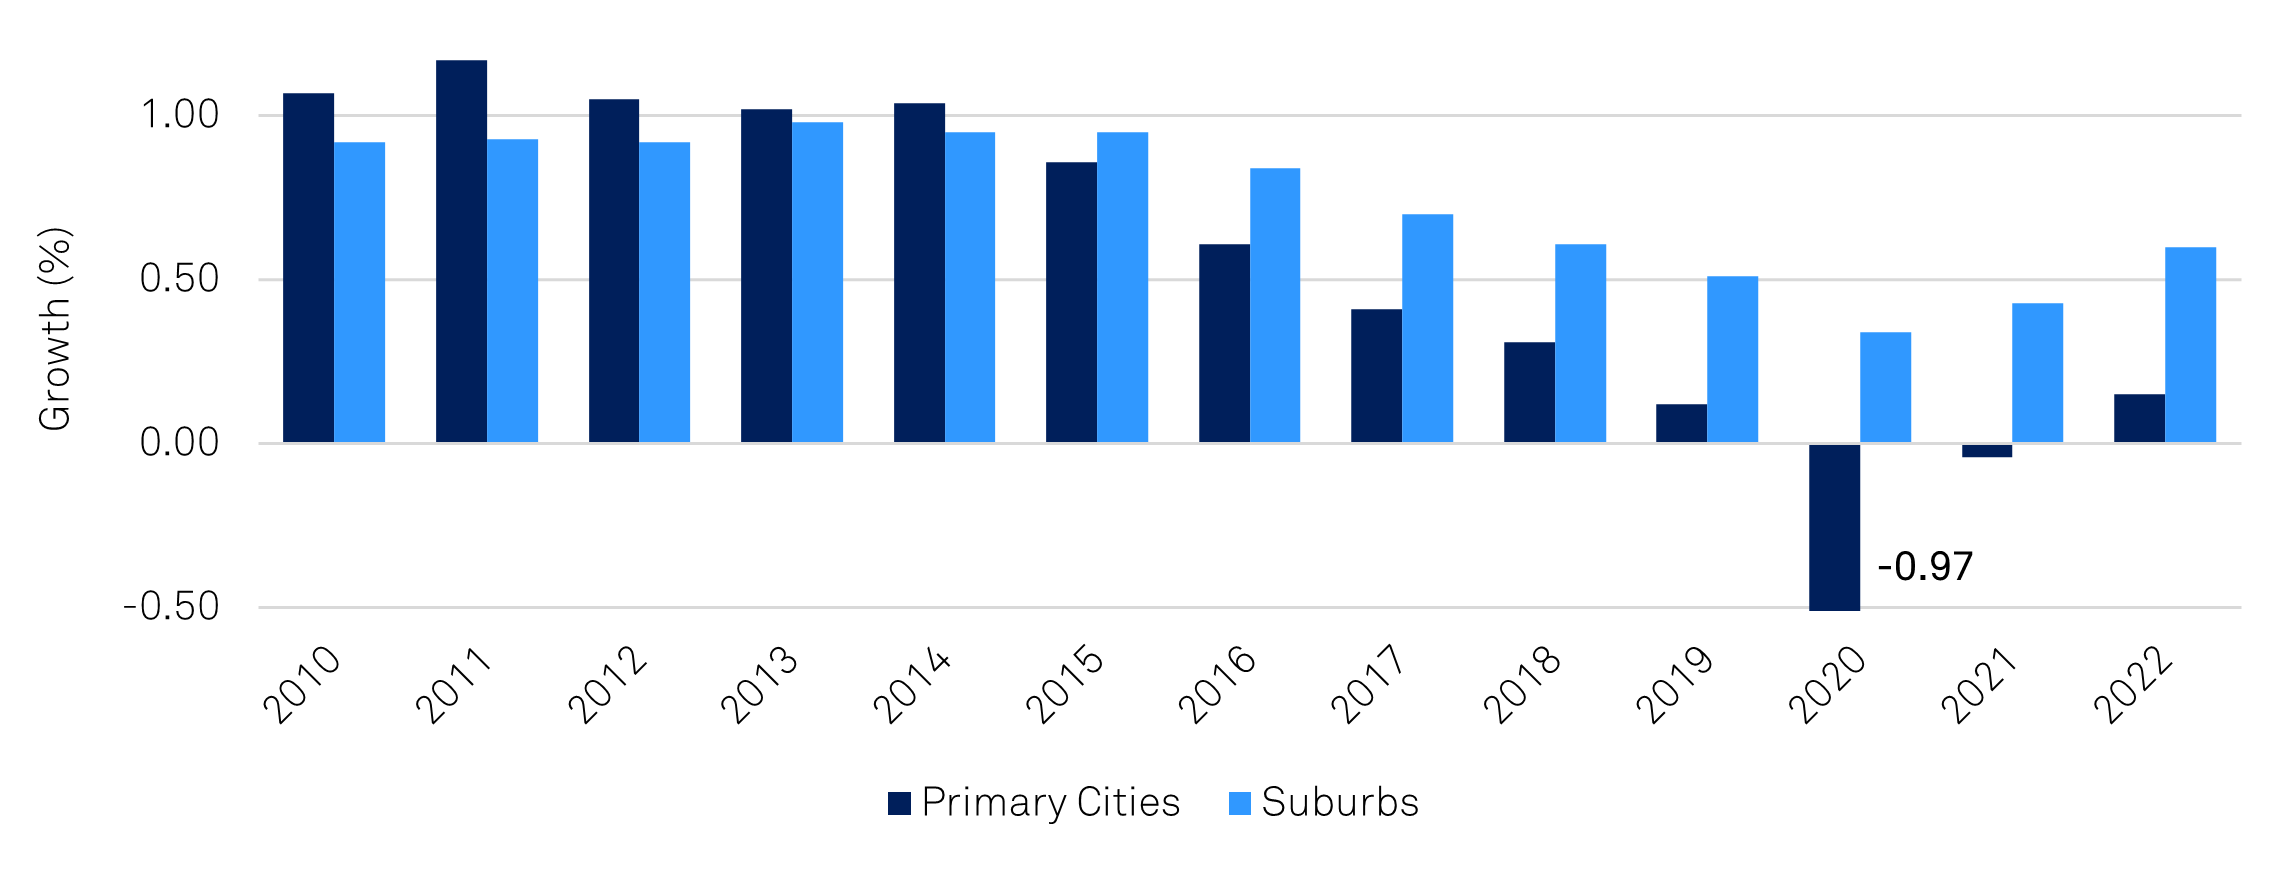
Sources: The Brookings Institution, as of June 6, 2024.
We define PBRC as, single-family detached home and/or attached townhome communities consisting of primarily three- and four-bedroom homes, built solely for rentals, adding new single-family supply in traditionally under-supplied suburban submarkets. These communities are ideally suited across generations: for millennials aging into the single-family lifestyle and baby boomers seeking to move out of home-ownership responsibilities. Like traditional multifamily, PBRC has been impacted by elevated levels of supply versus historical levels. As a result, we believe the most attractive ways to access this niche in the coming year will arise from 1) providing rescue capital in the form of preferred equity for developers with aggressive underwriting assumptions in need of refinancing expiring debt, or 2) acquiring assets directly from homebuilders, at certificate of occupancy, below replacement cost in strong submarkets experiencing easing supply pressures and strong demand drivers that reduce the lease-up risk associated with the business plan.

Essential Service Retail
While the industrial and residential subsectors have had their fair share of time in the sun, retail was largely forgotten by most institutional investors in the last decade. However, sentiment has shifted meaningfully for the sector and fundamentals are emerging as the strongest across core subsectors. Retail remains insulated from new supply as rents across the sector still do not justify new development (Figure 3); supply for the sector is not expected to surpass 0.5% of existing inventory for the foreseeable future.
Figure 3: Rent growth required to justify new development by market (Colored by market-level supply barriers)
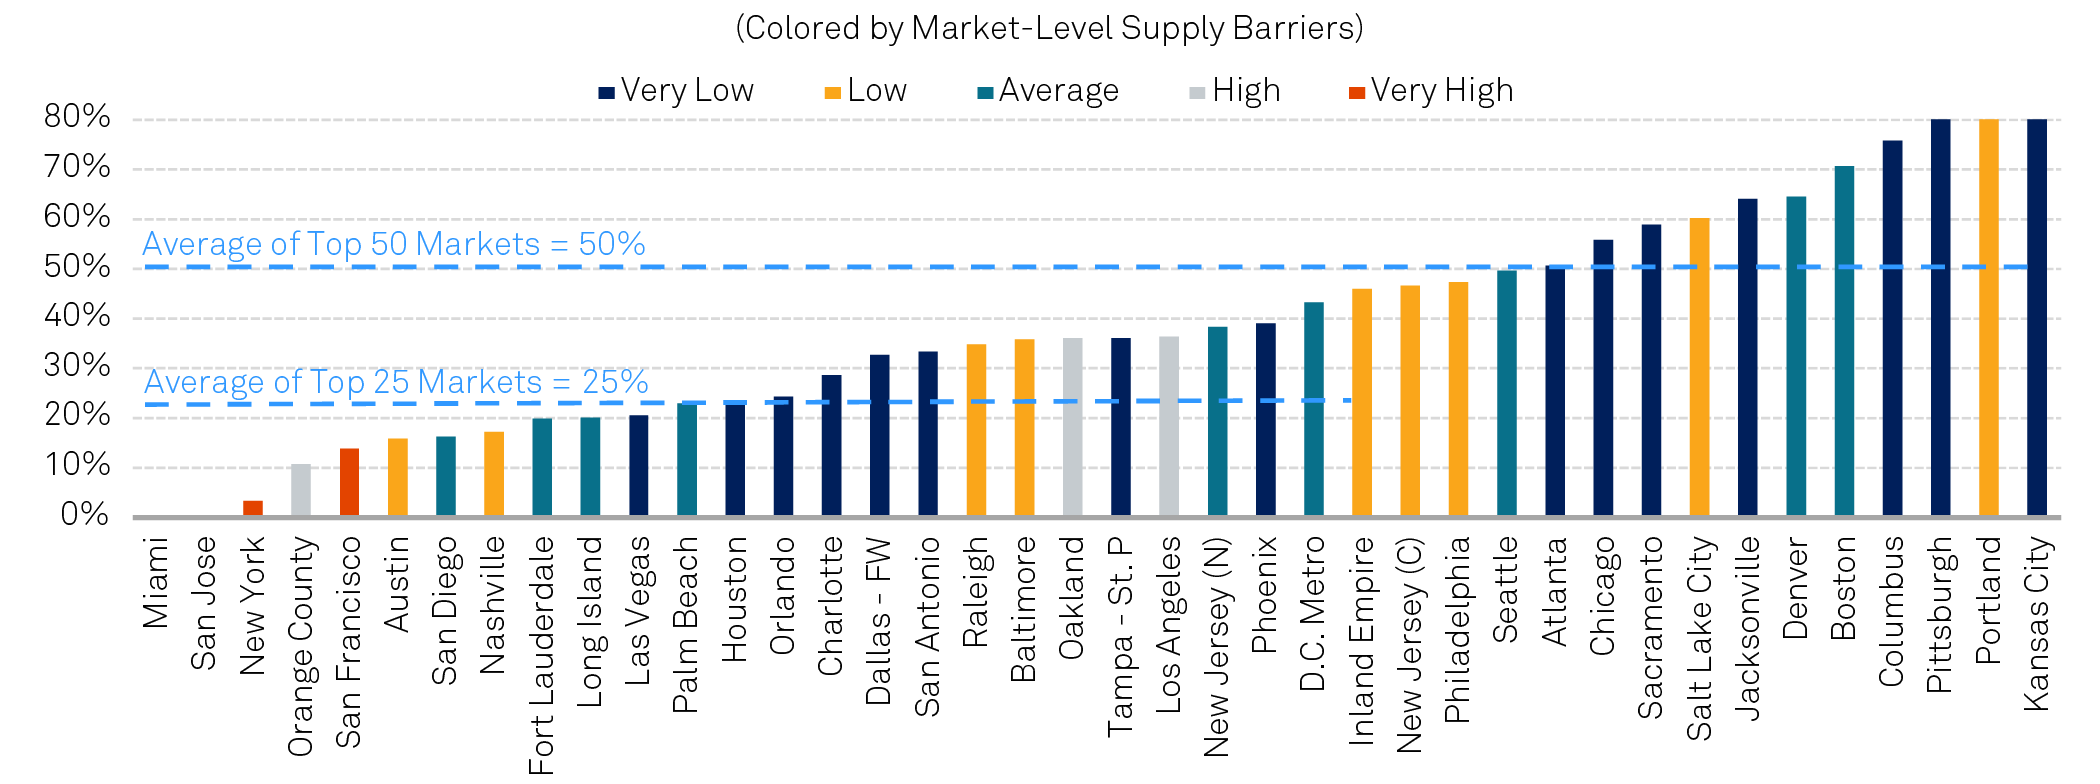
Sources: Green Street - U.S. Strip Center Outlook, as of January 24, 2025.
Interest from institutional investors in the sector has been particularly concentrated in grocery-anchored shopping centers. Blackstone’s acquisition of Retail Opportunity Investments Corp. (Nasdaq: ROIC) at a 6% nominal cap rate (or 5% economic cap rate after capex) in November last year, arguably made the largest splash in the market and indicated institutional investor appetite returning to the sector en masse. We remain focused on Essential Service Retail (ESR), a niche subsector in which competition from capital has not forced cap rates to such low levels.
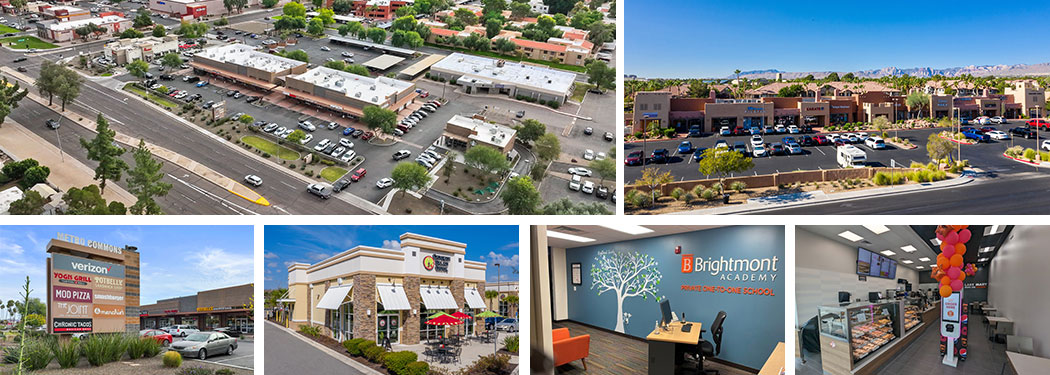
ESR consists of unanchored shopping centers leased to e-commerce resistant tenants whose customers must visit the store to consume the service (i.e., hair salons, coffee shops, dentists). These are typically 20,000 to 40,000 square foot shopping centers with average suite sizes less than 2,000 square feet, catering to a wide array of tenants. Strong fundamentals have resulted in high occupancy (97%) and high re-leasing spreads (14%) in 2024 for this subsector, and we anticipate this strength to continue in the coming year. Additionally, the lack of institutional ownership across the subsector lends itself to strong income growth at the property level from simply institutionalizing operations, offering attractive returns with limited business plan execution risk.
The return of capital
For institutional real estate investors, capital markets in the last few years have been meaningfully impacted by “the denominator effect,” an overallocation to real estate that limited capital deployment into the asset class. Today, however, as real estate valuations have begun to reset and equity markets have generated strong returns, real estate allocations have been right-sized and institutional investors find themselves under-allocated once again (Figure 4). As a result, 85% of global institutional investors expect to deploy capital across real estate in 2025, with an outsized preference for the residential and industrial sectors³. Further, as investors weigh the investment opportunities ahead, they prefer value-add strategies, as credit offers more competitive risk-adjusted returns compared to core real estate strategies in this elevated interest rate environment (Figure 5).
Figure 4: Actual versus target allocations to real estate
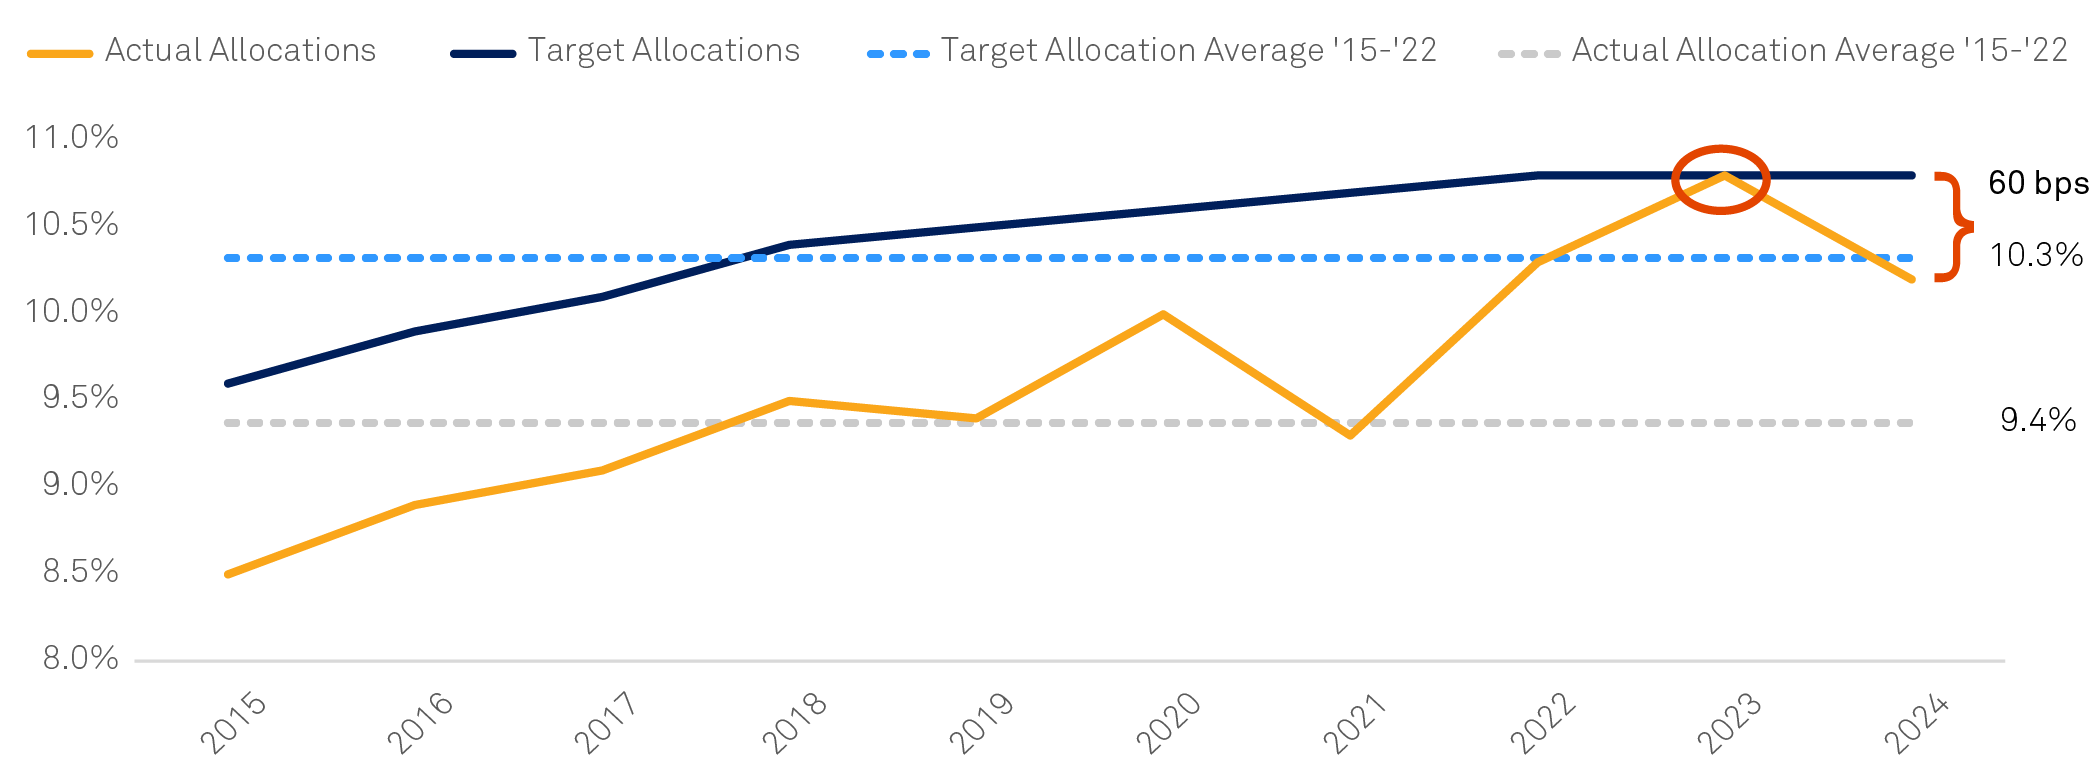
Sources: Hodes Weill & Associates - 2024 Institutional Real Estate Allocations Monitor, as of December 31, 2024.
Figure 5: Investors’ strategy preference historically
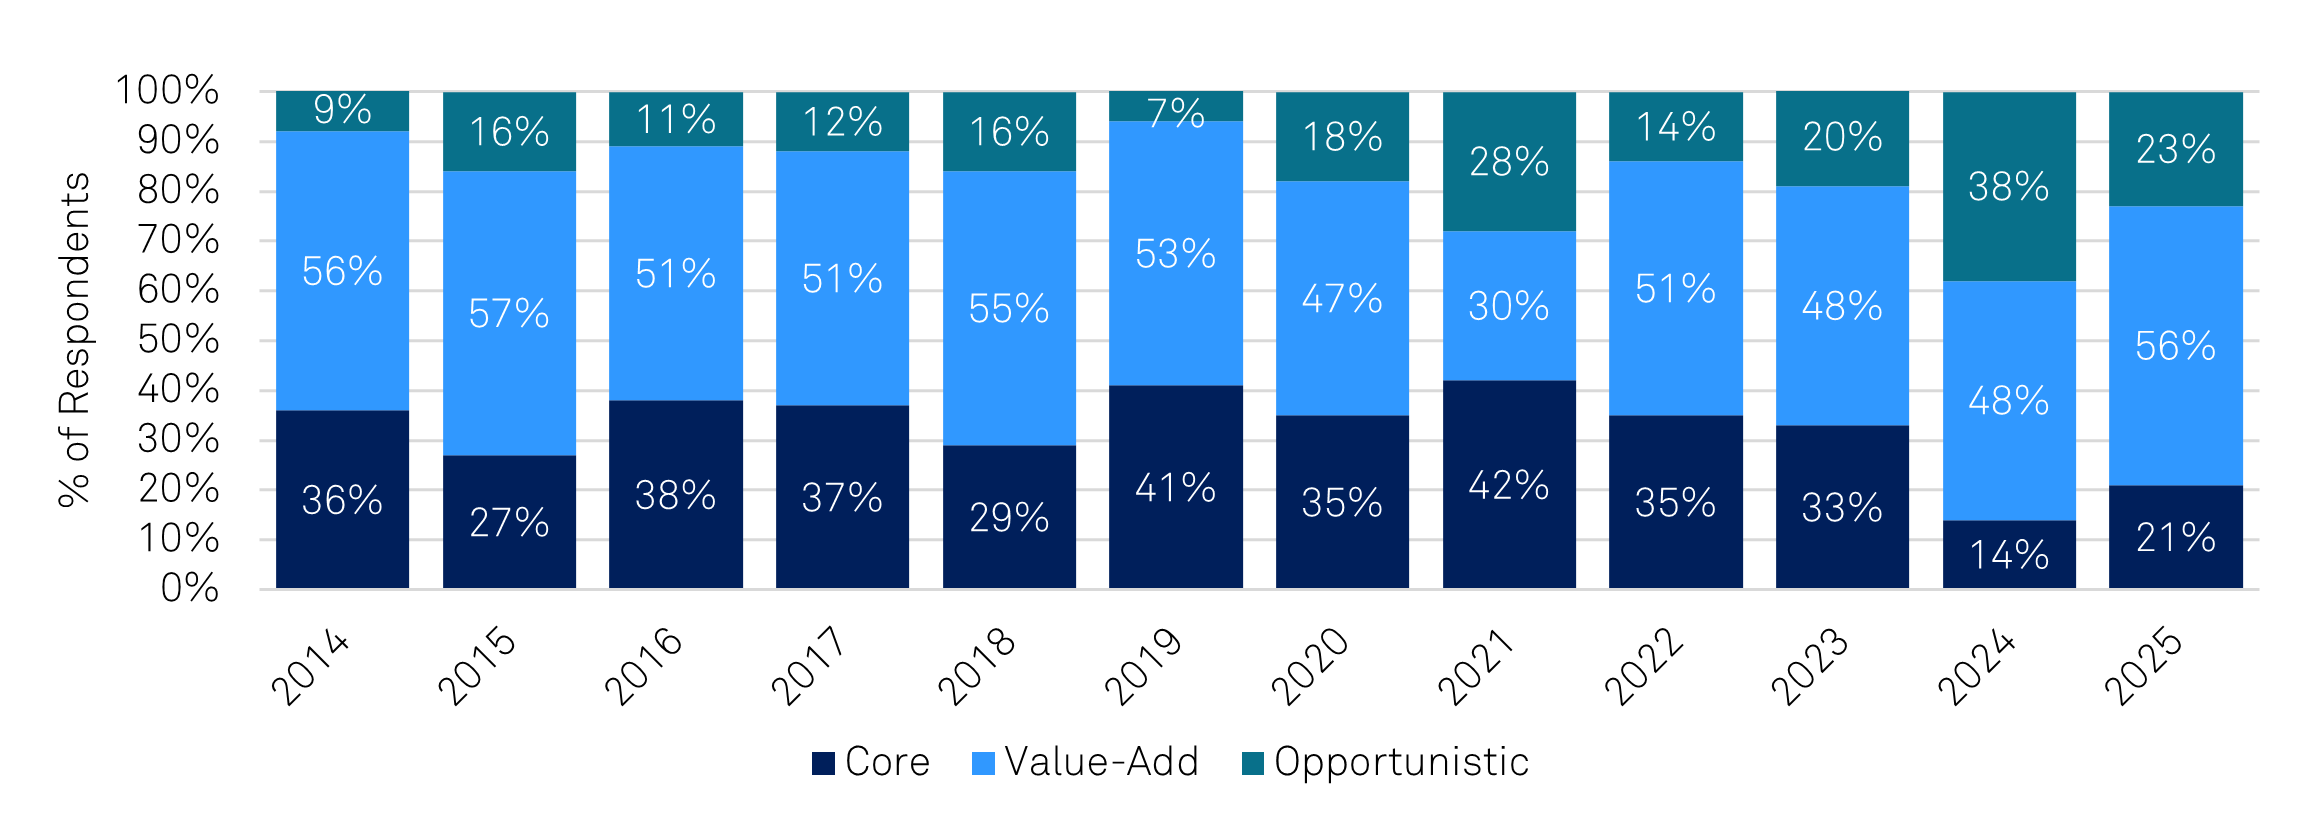
Sources: PREA 2025 Investment Intentions Survey, as of November 2024. The above data includes forward looking information, actual results may be materially different.
We anticipate this investor appetite to deploy capital will be coupled with two developments in the real estate debt markets to drive transaction volumes: 1) existing lenders no longer willing to extend and modify terms on an expected nearly $1 trillion in loans maturing this year, and 2) increased debt availability from alternative providers of debt capital (more to come on this in our upcoming private real estate debt outlook).
Increased transaction activity should also lead to rationality on true valuations. We have seen the private market (mainly ODCE funds) lagging meaningfully on appraisals as valuers continue pointing to a lack of comparable transactions. Consequently, appraisal cap rates across core properties⁴ are essentially on top of the 10-year treasury yield today (Figure 6). Historically, when the spread between the 10-year treasury yield and appraisal cap rates collapsed, a meaningful cap rate expansion followed. As outlined in our macro outlook, we anticipate treasury yields to remain above 4% for the foreseeable future, which would warrant appraisal cap rates closer to 5.5% if they were to return to historical spreads versus the 10-year treasury yield, creating additional pressure on appreciation returns across most core funds.
Figure 6: Core private real estate cap rates versus the 10-year treasury yield
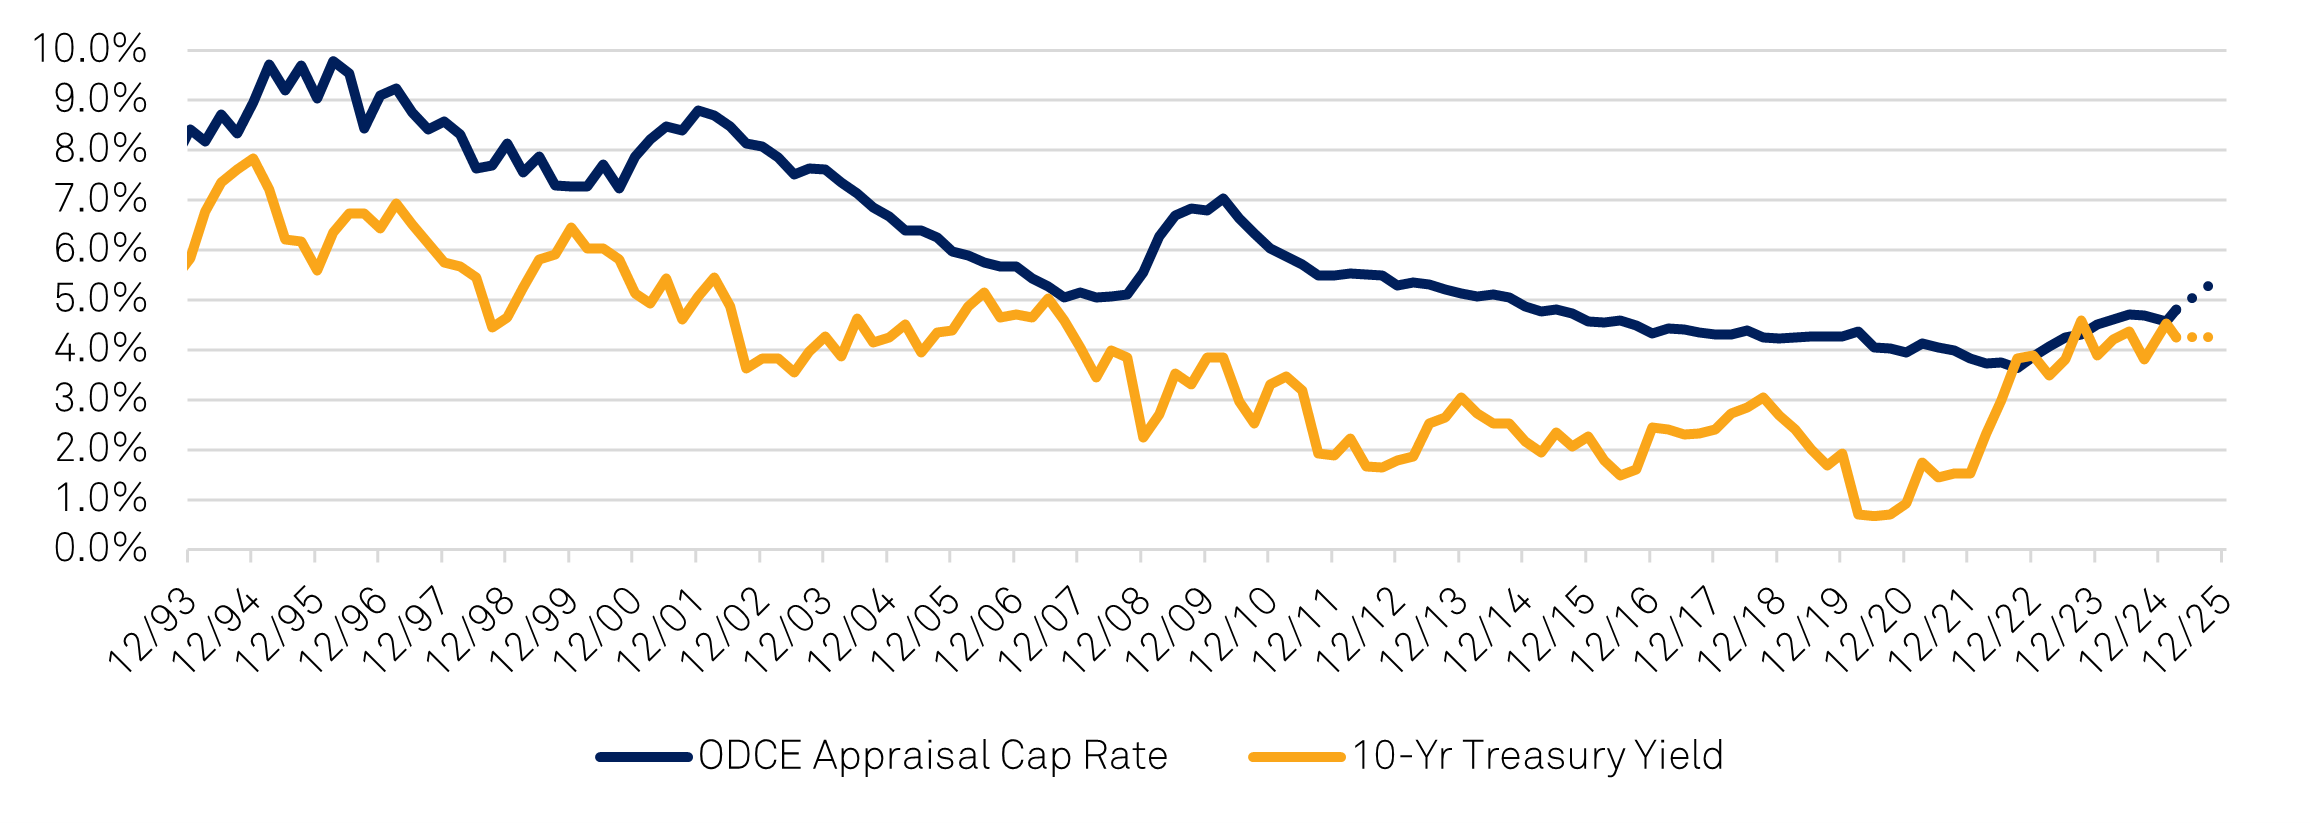
Sources: NCREIF, Bloomberg, as of January 30, 2025. The above data includes forward looking information, actual results may be materially different.
As valuations reset, investors should recognize that the time to invest is now. Those who invested in real estate through the recovery following the Global Financial Crisis can attest to the benefits of investing early in the market cycle. The difference in cumulative returns between those who invested at the trough versus those who waited just two years is greater than 70% (Figure 7).
Figure 7: Cumulative total returns following the Global Financial Crisis through end of 2024
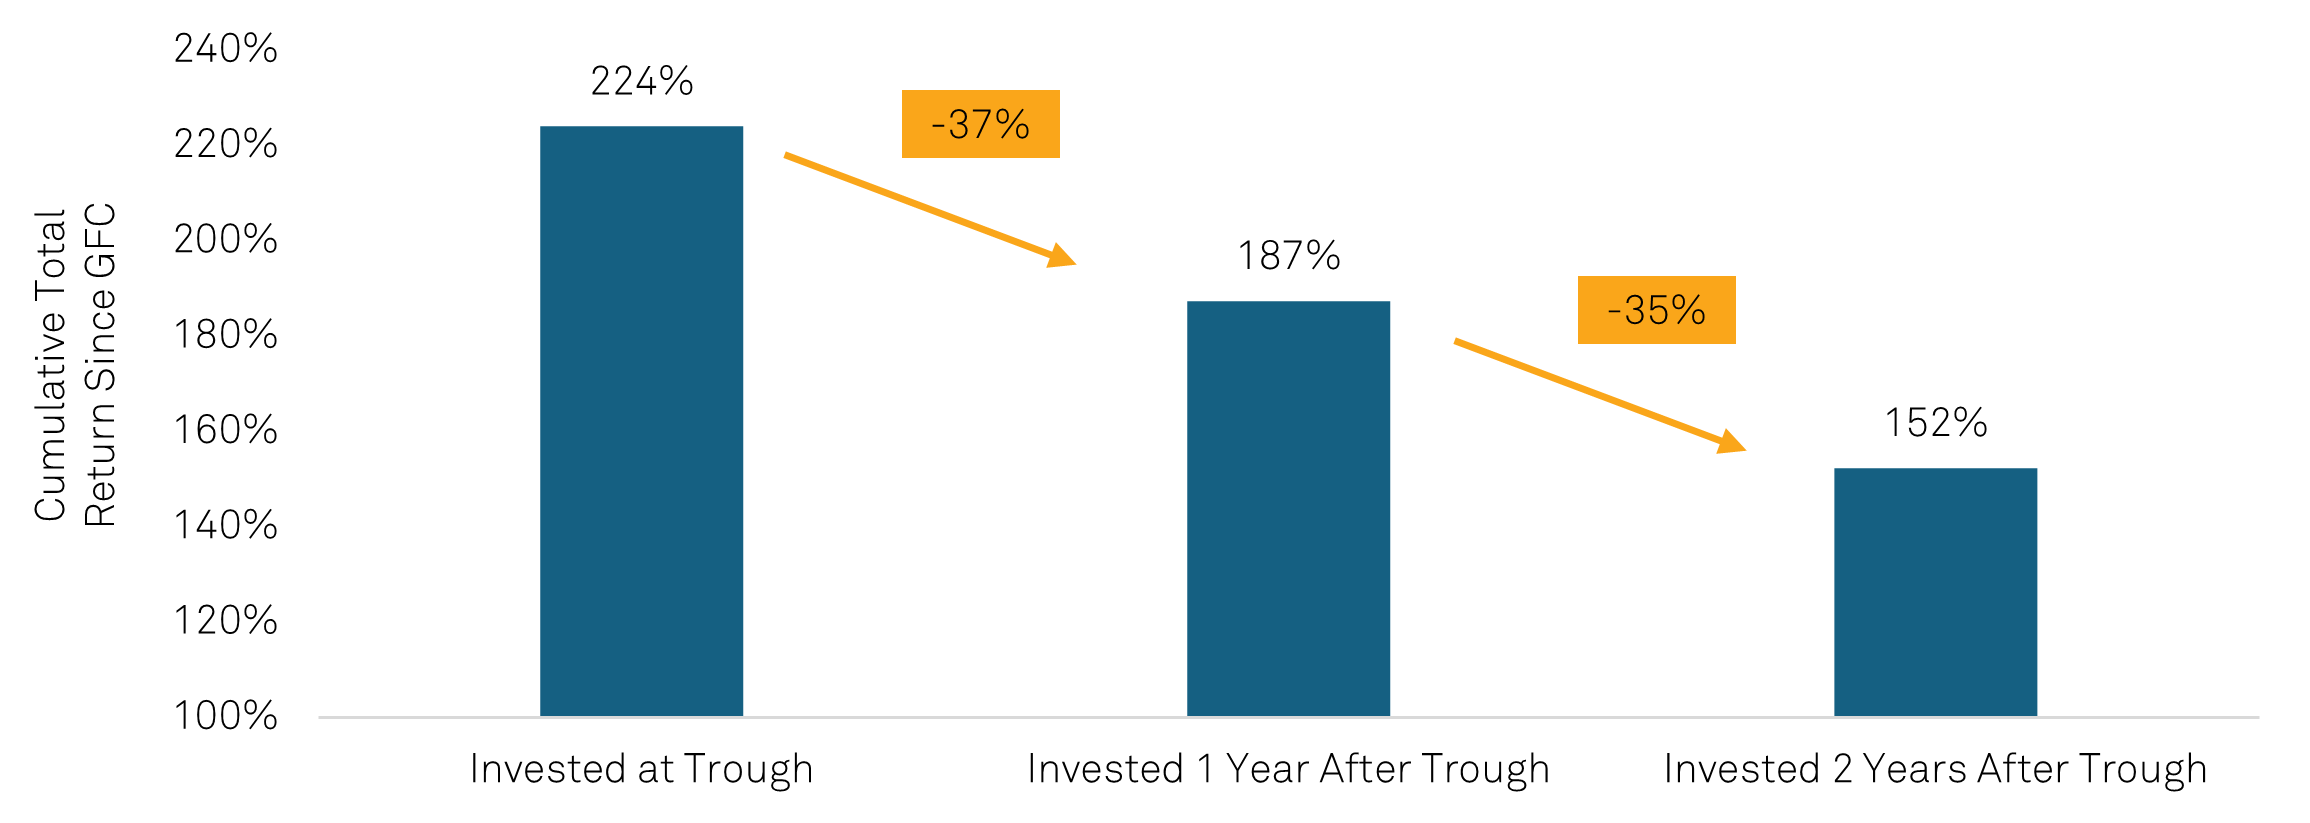
Sources: NCREIF, as of February 5, 2025.
Resetting valuations
While resetting valuations will provide an excellent entry point for investment in traditional sectors, asset selection remains critical. Multifamily and industrial have represented the most favored sectors among commercial real estate investors in the last decade, attracting 60% of capital deployed during that period⁵.
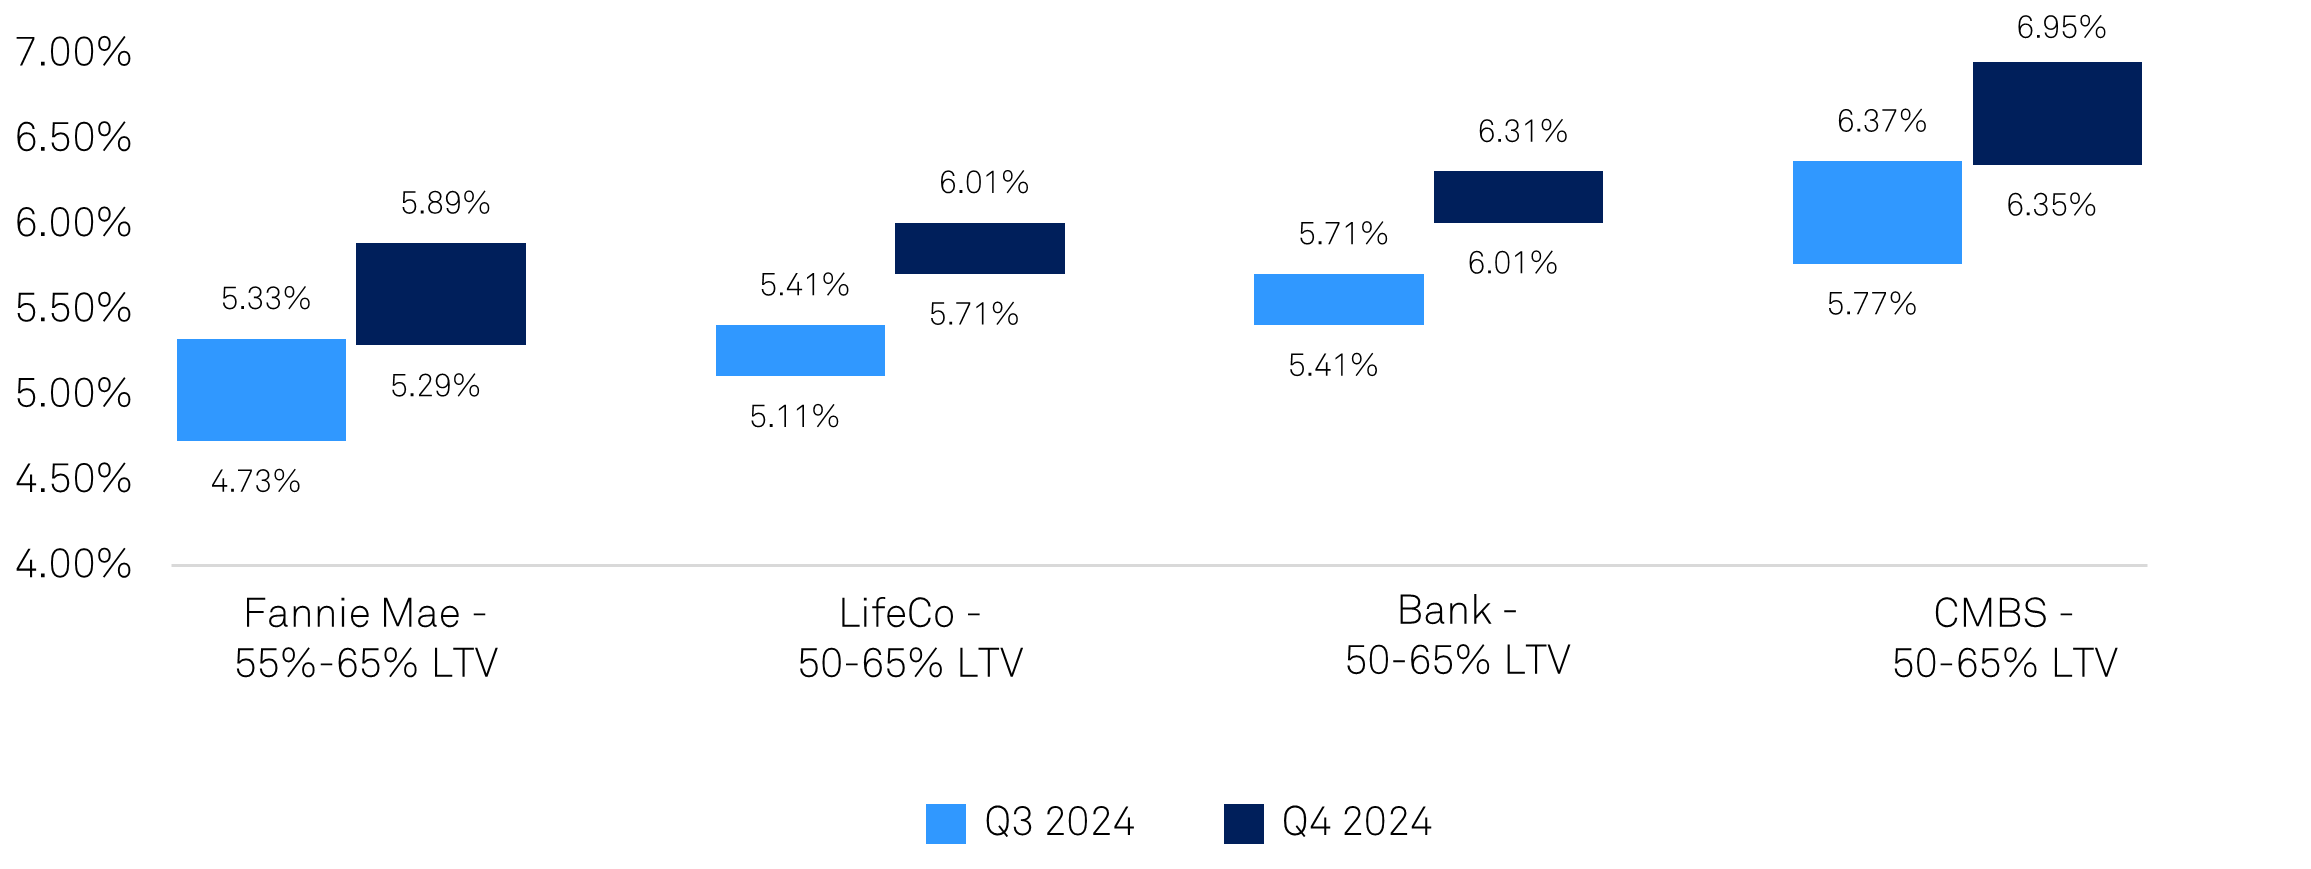
Despite the supply headwinds facing both subsectors pressuring valuations and fundamentals during 2024, most investors across the private market have demonstrated a willingness to take the long-term view as new starts data indicate an approaching reprieve in new supply combined with demand drivers that remain strong. For multifamily, the structural undersupply of housing in the U.S. combined with the unaffordability of home ownership continues to create renters for longer. Across the industrial sector, building resiliency into supply chains to withstand geopolitical, climate-related, or other shocks, along with near-shoring and on-shoring are likely to continue driving investment into supply chain infrastructure. As such, while fundamentals have been temporarily challenged, capital continues to chase quality deals that have come to the market, keeping a lid on cap rates despite elevated borrowing costs resulting in negative leverage on deals. For example, apartments across ODCE funds transacted at an average 4.86% cap rate in the fourth quarter of 2024 while funding costs continued to rise well above those levels (Figure 8).
Figure 8: Change in multifamily debt costs from 3Q24 to 4Q24
Sources: Colliers, as of December 31, 2024.
In this environment, the strongest risk-adjusted returns across traditional multifamily can be found in accessing high-quality, differentiated assets at a basis significantly below replacement cost. Capital’s desire for multifamily remains strong which keeps pricing very competitive; therefore, specific asset selection is critical to generating outperformance and capturing the benefit of pricing power through advantageous competitive positioning – larger floor plans, top-rated schools, and lower density product in established, high-quality demographic areas more insulated from competitive supply. Merely acquiring commodity product and hoping the rising tide of a broad recovery lifts all ships is not a recipe for outperformance as it had been in the prior cycle in which lower interest rates and cap rates were mistaken for alpha generation.
The strongest risk-adjusted returns in traditional industrial can be found by focusing on smaller buildings in infill locations offering transportation and other cost advantages for delivering goods to end users. Established, fully-developed locations with high population density provide pricing power and face limited competitive new supply relative to commodity bulk distribution, which can quickly fall down the competitive scale as newer product with better distribution functionality comes online. The attractive value-add strategy here is to acquire assets at a discounted basis due to vacancy, make select improvements to enhance functionality, and then stabilize to a higher yield on cost than is available from acquiring leased assets with a shrinking mark-to-market opportunity.
Another area of opportunity is likely to be rescue capital in the form of preferred equity or other structured finance investments for development deals that were underwritten in the days of free-flowing, low-interest rate debt. As many of these deals have delivered into a market with elevated supply, assets are meaningfully underperforming expectations with issues like longer lease-up times, lower occupancy levels, higher concessions, and lower market rents all weighing on cash flows while maturing construction loans need to be replaced with debt at pricing significantly higher than expectations. In these instances, for high-quality assets in strong markets that simply need to make it to the other side of the current wave of supply, preferred equity provides a compelling opportunity to generate strong risk-adjusted IRRs.
Resetting valuations are creating the ideal entry point for private real estate in 2025, but where to strategically deploy capital is equally as important as when. Hopes for a broad recovery will not be enough to generate outperformance – opportunity lies for astute investors in niche subsectors and careful asset selection.
In 2025, success in private real estate will favor those who target niche opportunities with strong fundamentals and long-term resilience.
¹ CBRE Econometric Advisors, 4Q 2024. Represents assets smaller than 25ksf.
² John Burns Research and Consulting, LLC, as of December 31, 2024. Median housing payment assumes the purchase of a home at 80% of the market’s median-priced resale home, 5% down payment, and a 30-year, fixed-rate mortgage. Payment is PITI and includes mortgage insurance.
³ PREA 2025 Investment Intentions Survey.
⁴ As measured by the NCREIF ODCE Index.
⁵ CoStar, as of February 5, 2025, multifamily and industrial sales volume as a percentage of all subsectors sales volume (2015-2024).
General Disclosures
Any statement of opinion constitutes only the current opinion of CenterSquare and its employees, which are subject to change and which CenterSquare does not undertake to update.
Material in this publication is for general information only and is not intended to provide specific investment advice or recommendations for any purchase or sale of any specific security or commodity. Due to, among other things, the volatile nature of the markets and the investment areas discussed herein, investments may only be suitable for certain investors. Parties should independently investigate any investment area or manager, and should consult with qualified investment, legal, and tax professionals before making any investment. Some information contained herein has been obtained from third party sources and has not been independently verified by CenterSquare Investment Management LLC (“CenterSquare”). CenterSquare makes no representations as to the accuracy or the completeness of any of the information herein. Accordingly, this material is not to be reproduced in whole or in part or used for any other purpose. Investment products (other than deposit products) referenced in this material are not insured by the FDIC (or any other state or federal agency), are not deposits of or guaranteed by CenterSquare, and are subject to investment risk, including the loss of principal amount invested.
For marketing purposes only. Any statements and opinions expressed are as at the date of publication, are subject to change as economic and market conditions dictate, and do not necessarily represent the views of CenterSquare or any of its affiliates. The information has been provided as a general market commentary only and does not constitute legal, tax, accounting, other professional counsel or investment advice, is not predictive of future performance, and should not be construed as an offer to sell or a solicitation to buy any security or make an offer where otherwise unlawful. The information has been provided without taking into account the investment objective, financial situation or needs of any particular person. Any indication of past performance is not a guide to future performance. The value of investments can fall as well as rise, so investors may get back less than originally invested.
Because the investment strategies concentrate their assets in the real estate industry, an investment is closely linked to the performance of the real estate markets. Investing in the equity securities of real estate companies entails certain risks and uncertainties. These companies experience the risks of investing in real estate directly. Real estate is a cyclical business, highly sensitive to general and local economic developments and characterized by intense competition and periodic overbuilding. Real estate income and values may also be greatly affected by demographic trends, such as population shifts or changing tastes and values. Companies in the real estate industry may be adversely affected by environmental conditions. Government actions, such as tax increases, zoning law changes or environmental regulations, may also have a major impact on real estate. Changing interest rates and credit quality requirements will also affect the cash flow of real estate companies and their ability to meet capital needs.
Definition of Indices
FTSE Nareit All Equity REITs Index “FNER”
The FTSE Nareit All Equity REITs Index is a free-float adjusted, market capitalization-weighted index of U.S. equity REITs. Constituents of the index include all tax-qualified REITs with more than 50 percent of total assets in qualifying real estate assets other than mortgages secured by real property.
NCREIF Fund Index – Open End Diversified Core Equity (ODCE)
The ODCE, short for NCREIF Fund Index - Open End Diversified Core Equity, is the first of the NCREIF Fund Database products and is an index of investment returns reporting on both a historical and current basis the results of 36 open-end commingled funds pursuing a core investment strategy, some of which have performance histories dating back to the 1970s
CenterSquare REIT Cap Rate Perspective Methodology
CenterSquare REIT Implied Cap Rates are based on a proprietary calculation that divides a company’s reporting net operating income (“NOI”) adjusted for non-recurring items by the value of its equity and debt less the value of non-income producing assets. The figures above are based on Q4 2024 earnings reported in September 2024.
The universe of stocks used to aggregate the data presented is based on CenterSquare’s coverage universe of approximately 200 U.S. listed real estate companies. Sector cap rates are market cap weighted. Sectors and market classifications are defined by the following:
Apartment: REITs that own and manage multifamily residential rental properties; Industrial: REITs that own and manage industrial facilities (i.e. warehouses, distribution centers); Office – REITs that own and manage commercial office properties; Retail – REITs that own and manage retail properties (i.e. malls, shopping centers); Hotel – REITs that own and manage lodging properties; Healthcare – REITs that own properties used by healthcare service tenants (i.e. hospitals, medical office buildings); Gateway – REITs with portfolios primarily in the Boston, Chicago, LA, NYC, SF, and DC markets; Non-Gateway – REITs without a presence in the gateway markets.
The REIT ODCE Proxy is a universe of REIT stocks built to resemble the NCREIF Fund Index – Open End Diversified Core Equity (ODCE). The ODCE, short for NCREIF Fund Index - Open End Diversified Core Equity, is the first of the NCREIF Fund Database products and is an index of investment returns reporting on both a historical and current basis the results of 36 open-end commingled funds pursuing a core investment strategy, some of which have performance histories dating back to the 1970s. The REIT ODCE Proxy is proprietary to CenterSquare and uses gateway/infill names in apartments, retail, industrial and office, and then weights them according to the ODCE index to create a proxy.
Private Market Cap Rates represent the cap rate achievable in the private market for the property portfolio owned by each company and are based on estimates produced by CenterSquare’s investment team informed by various market sources including broker estimates.
These benchmarks are broad-based indices which are used for illustrative purposes only. The investment activities and performance of an actual portfolio may be considerably more volatile than these indices and may have material differences from the performance of any of this index. A direct investment in an index is not possible.
FTSE Data disclosure: Source: FTSE International Limited (“FTSE”) © FTSE 2025. FTSE® is a trade mark of the London Stock Exchange Group companies and is used by FTSE under licence. All rights in the FTSE indices and / or FTSE ratings vest in FTSE and/or its licensors. Neither FTSE nor its licensors accept any liability for any errors or omissions in the FTSE indices and/ or FTSE ratings or underlying data. No further distribution of FTSE Data is permitted without FTSE’s express written consent.

