2025 Global REIT Outlook – Illuminating Opportunities Worldwide
January 2025
ILLUMINATING OPPORTUNITIES WORLDWIDE
2025 GLOBAL REIT OUTLOOK
Monetary policy, global trade politics, lagging private market valuations, and myriad other factors continue to drive uncertainty within the global equity market. However, we believe bright spots appear amid the murkiness across many areas in global REITs. In our 2025 Global REIT Outlook, we highlight sectors we believe will provide compelling investment opportunities in the year ahead across the U.S., Europe, and Asia Pacific markets.
U.S.
Our market outlook provides the macroeconomic backdrop we believe will define the coming year – continued inflationary pressure and meaningful uncertainties driven by unknown geopolitical, fiscal, and monetary policy implications. As such, we anticipate continued volatility across public markets as investors digest new information as it comes to light. We maintain conviction in a structurally higher long end of the yield curve, and we believe the market is slowly accepting that we have moved into a new era of debt costs that will remain above levels that became the norm after the Global Financial Crisis. This broader acceptance is likely to facilitate the survival of the fittest – business decisions and capital structures implemented during periods of irrational exuberance and free capital will fail to survive, creating opportunities for disciplined investors to find attractive external growth opportunities.
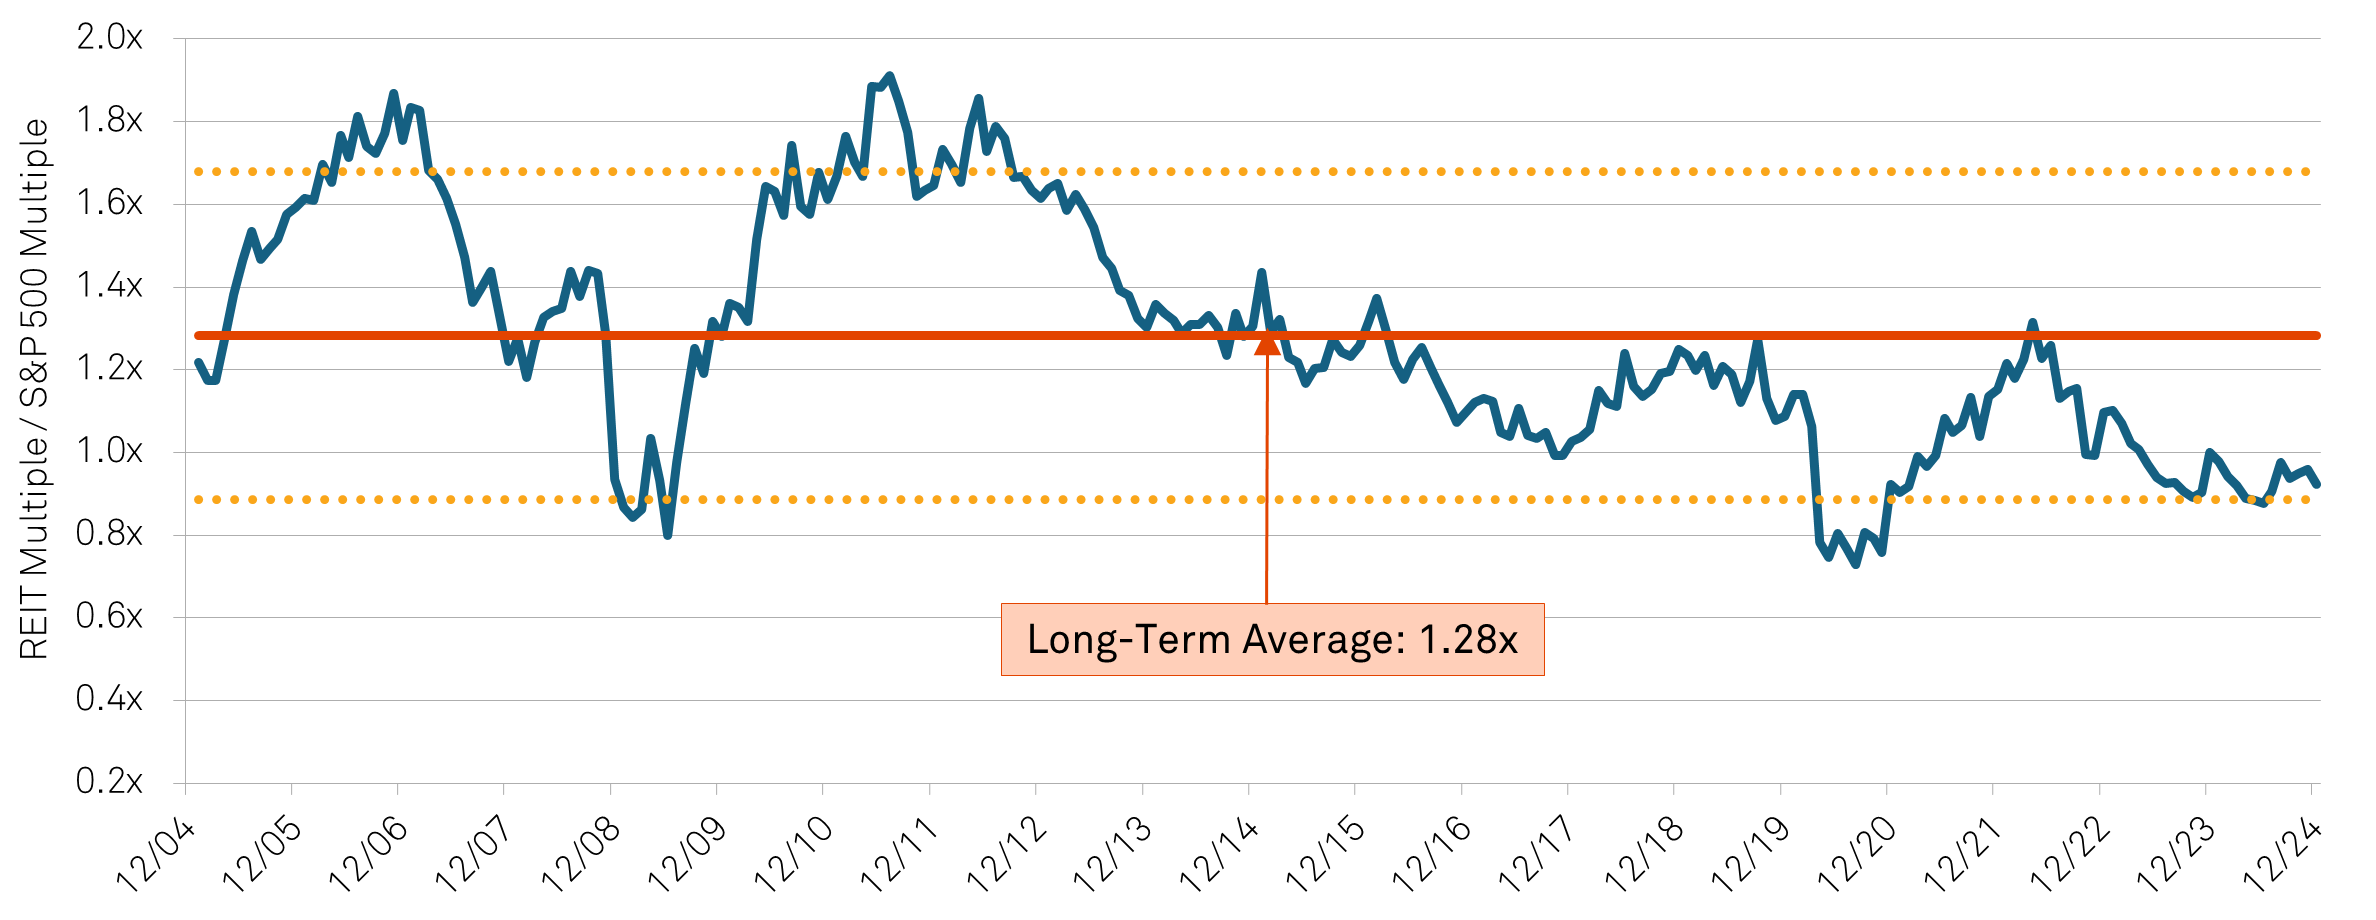
In the context of the broader equity market, we remain optimistic about the relative opportunity driven by valuations that screen more rational across REITs, where cash flow multiples are just slightly above the historical average over the last 20 years, while the S&P 500’s multiple going into the year was 1.66 standard deviations above the historical average over the same time. Consequently, REITs screen meaningfully more attractive versus the broader equity market on a relative basis, with the relative multiple for REITs versus the S&P 500 at 1.25 standard deviations below the historical average (Figure 1). Furthermore, the market’s acceptance of the reality of higher for longer long-term debt costs is likely to serve as a greater headwind for the broader equity market that has been driven by high-growth, technology-oriented companies as future earnings get discounted at a structurally higher rate than the last decade.
Figure 1: Historical relative forward multiple of U.S. REITs versus S&P 500
Sources: Bloomberg, Evercore ISI, Bank of America, Citi, Nareit, CenterSquare Investment Management as of December 31, 2024.
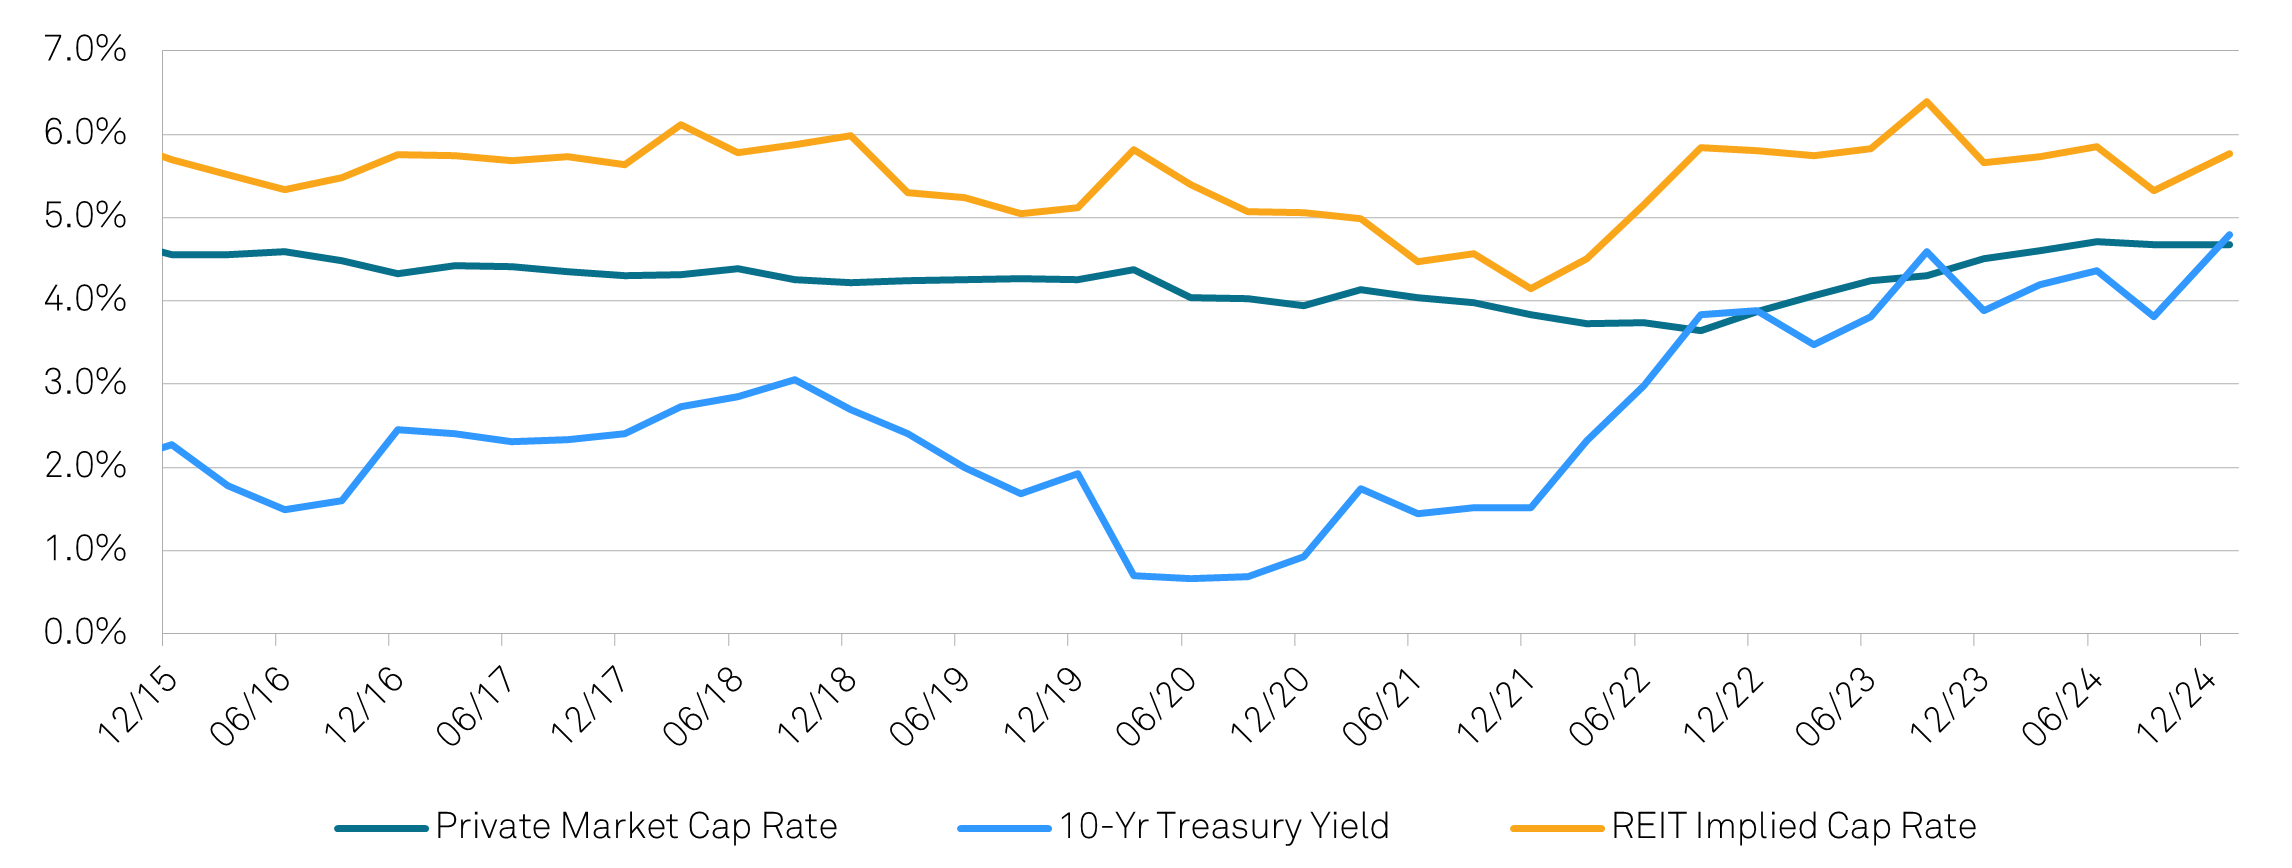
REITs also screen attractive versus the private real estate market – not only as it relates to valuations but also in this battle for the survival of the fittest. From a valuation perspective, the REIT market has already repriced for the elevated debt costs while the private market continues to lag (Figure 2). As a result, we anticipate further pressure on valuations in the private real estate market versus the listed real estate market. As we think about the survival of the fittest in the real estate sector and the unwinding of the upcoming wall of debt maturities, we anticipate REITs to deploy their lowly-levered balance sheets and relatively attractive cost of capital (and availability of capital) versus the private market to accretively acquire high-quality assets.
Figure 2: REIT implied cap rate and private real estate cap rate versus the 10-year treasury yield
Source: NCREIF, Bloomberg, CSIM, as of January 13, 2025. Note Private Market Cap Rate is ODCE.
As we manage exposures across the portfolio given the general uncertainty and volatility in the market, we remain focused on capturing real estate fundamentals we can control at rational valuations, leading us to be constructive about the senior housing and office sectors looking ahead over the coming year.
Senior Housing
One of the most notable secular themes we are monitoring, not only in the U.S. but around the world, is the aging population. This trend profoundly manifests itself within the real estate industry in the senior housing sector. Here, the confluence of several factors is creating a strong outlook regardless of the broader economic backdrop. In terms of fundamentals, the sector captures the demand associated with the Baby Boomer generation rapidly aging into the need for senior housing. Further, this generation is the wealthiest in history, providing ample room for rent growth without jeopardizing affordability. In fact, since 2008, rents across the senior housing sector have only increased 1.6x while the generation’s wealth has grown significantly more, causing affordability of senior housing to improve 3.8x during that same time period. While demand is increasing, however, new supply is decreasing as elevated construction costs make development of new senior housing economically inviable.
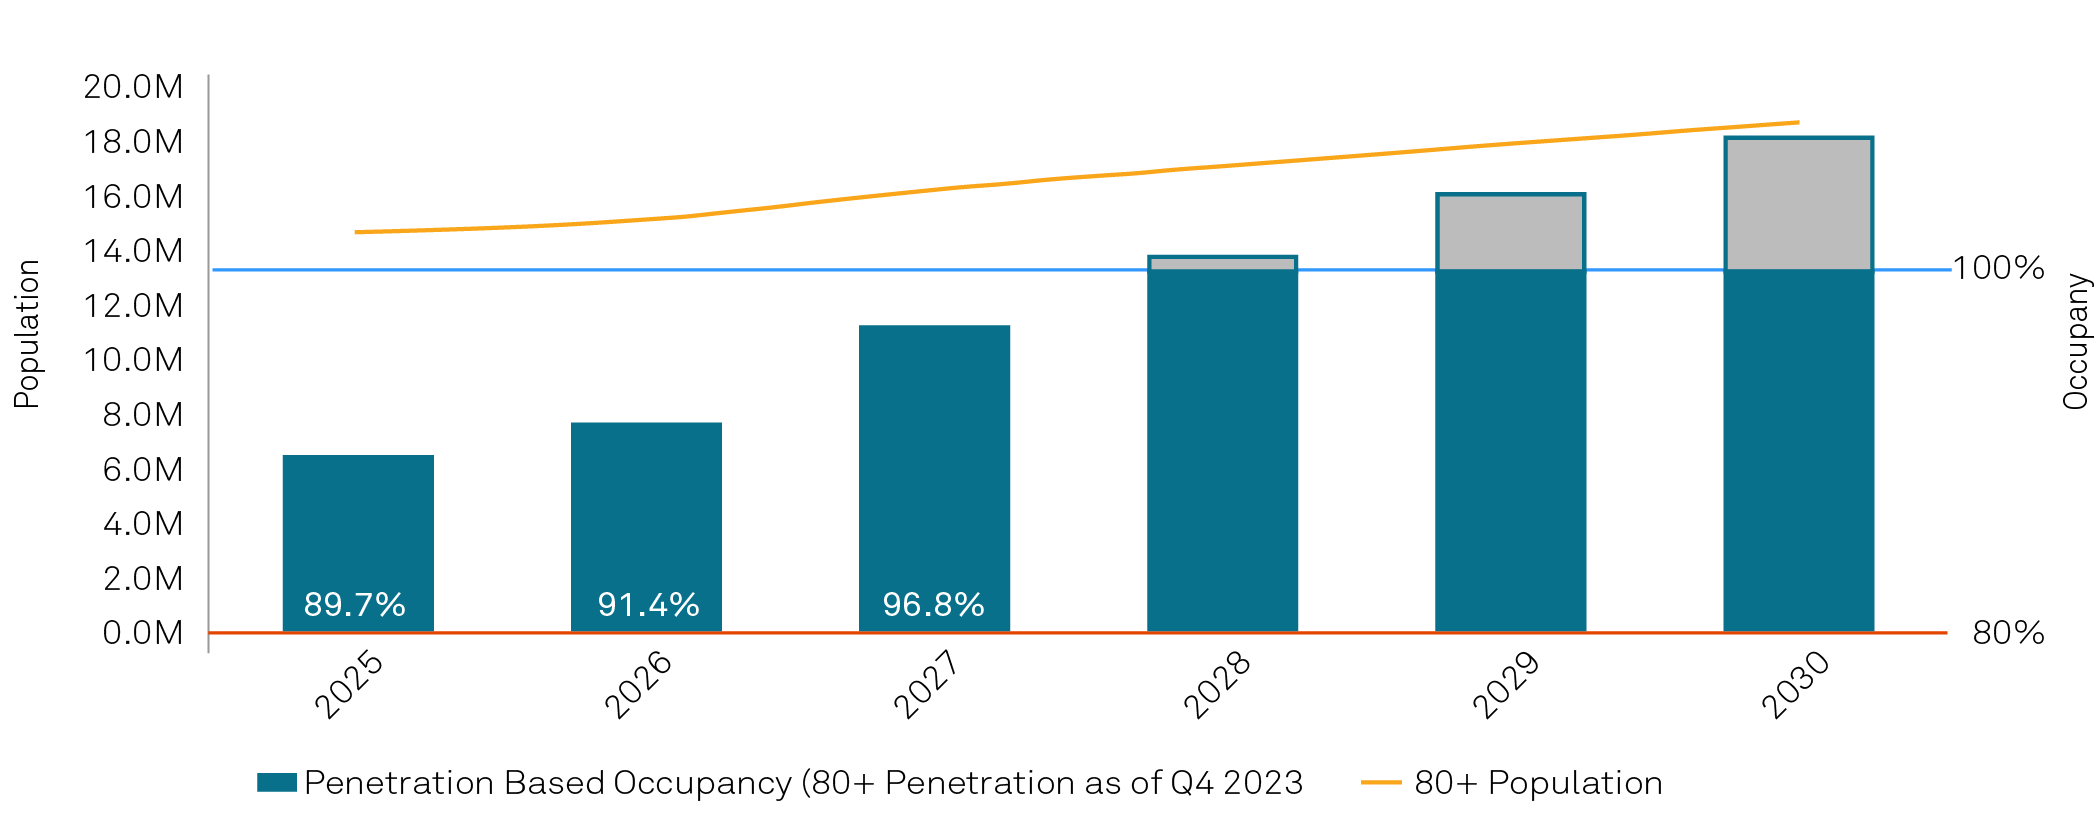
As a function, the REIT portfolios, with occupancies in the low- to mid-80% range, are expected to build occupancy through the coming year with a meaningful ramp in future years as the 80+ year old population grows at a faster rate (Figure 3). Furthermore, the sector is one of the most prominent beneficiaries of an attractive cost of capital driving accretive external growth opportunities as REITs can acquire assets in the private market at cap rates meaningfully higher than where their stocks are trading. This is driven in part by the lack of cap rate compression for this property type in the private market - its operationally intensive nature has kept private capital from pursuing this property type in earnest. While private market interest is beginning to increase because of the fundamental strength, REITs will continue to have a competitive advantage, not only in relation to their cost of capital, but also in their strong operating platforms developed over years of experience in the space.
Figure 3: Senior housing occupancy projections based on 80+ population growth
Source: National Investment Center for Seniors Housing & Care, as of October 24, 2024. The above data includes forward looking information, actual results may be materially different.
Office
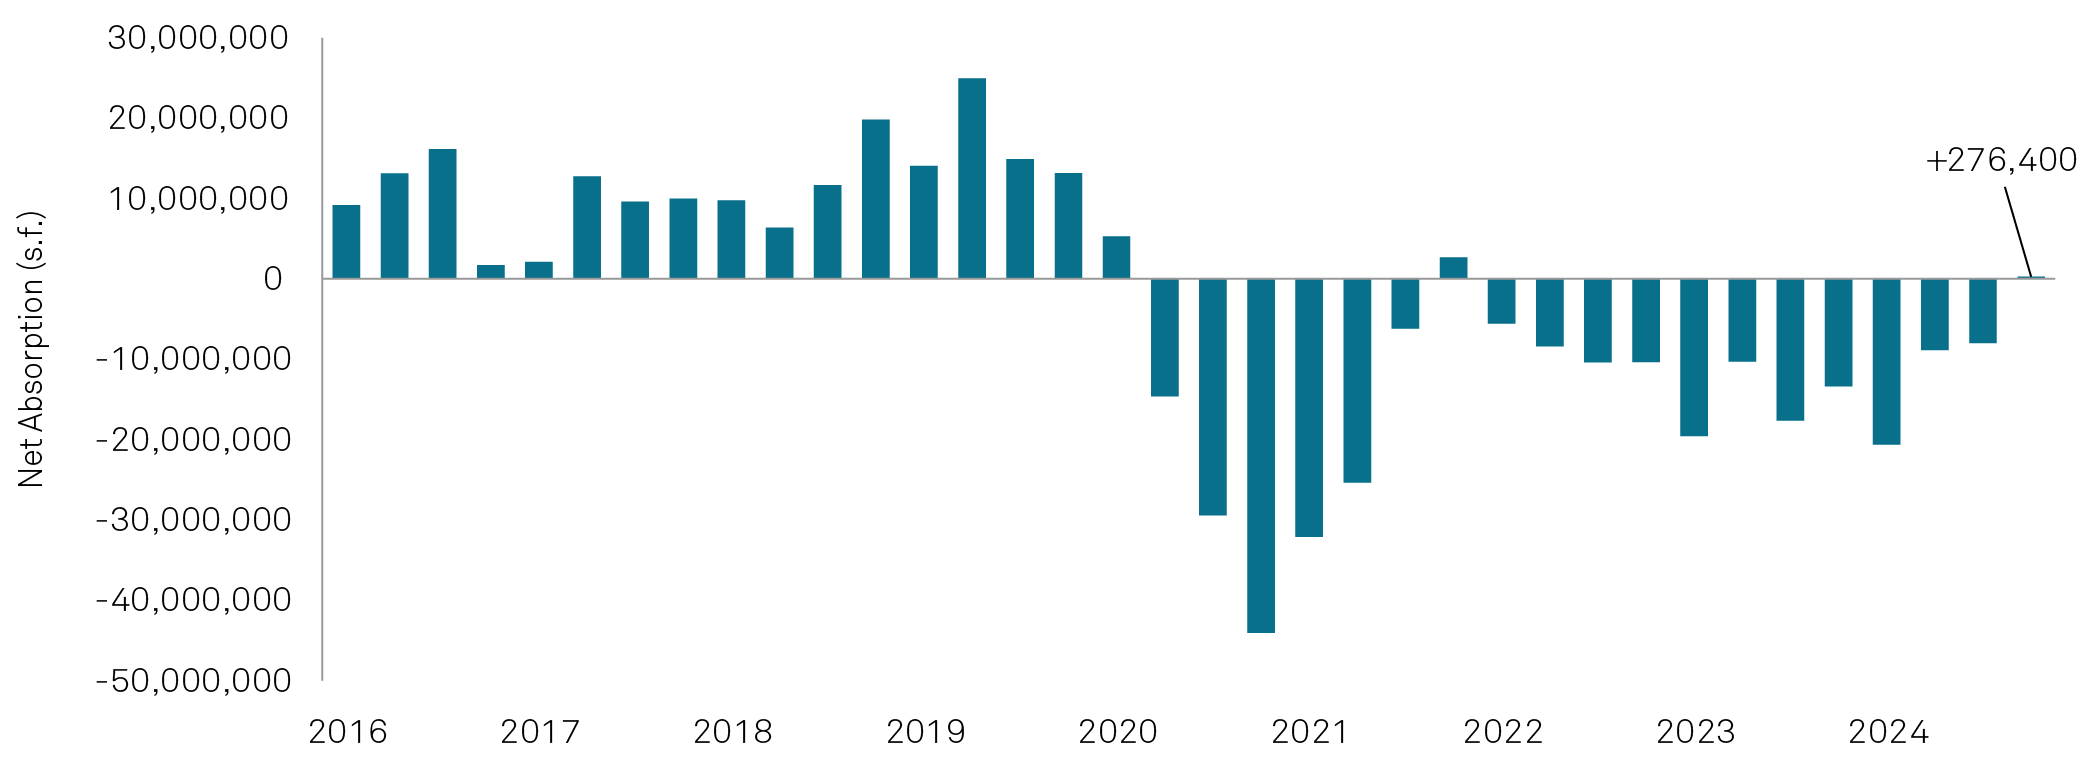
Since the onset of the COVID-19 pandemic, sentiment toward the office sector has significantly deteriorated as the value proposition of office space came into question. Today, more and more companies make headlines for issuing four- or five-day return to office requirements. While office tenants continue to rationalize their space needs to meet their evolving work environments, new demand is finally balancing the downsizing and fundamentals are beginning to show signs of improvement. Additionally, new supply for office remains at historical lows with as little as 500,000 square feet breaking ground in the last quarter of 2024. New deliveries are expected to decline by 20% in 2025, and an additional 75% each year through 2027 based on the current development pipeline (JLL, as of January 7, 2025). Concurrent to declining new supply, the rate at which office inventory is demolished or converted has increased more than 20% each year since pre-COVID levels. Together, these dynamics resulted in office leasing nearing pre-pandemic levels for the last quarter of 2024, and demand strengthening enough to mark the first quarter of positive net absorption since 2021, and just the second time since the pandemic began (Figure 4).
While the headline numbers are promising, it is important to note there remains a meaningful bifurcation between the “haves” and “have nots” within office, with newer and higher quality space continuing to win while lower-quality space increasingly becomes obsolete. In this bifurcation, the REITs are well-positioned as their portfolios represent the top tier of office product in major markets. Additionally, the property type remains under pressure from a capital markets perspective as the need for debt refinancings is occurring in tandem with higher interest rates and lower valuations compared to when the debt was initially placed. As owners struggle to reconstitute their capital stacks, the REITs, with their relative balance sheet strength and competitive cost of capital, will have the ability to creatively deploy capital to acquire high-quality assets and drive accretive growth. While the sector was among the best performers across REITs last year, it has underperformed the U.S. REIT market by nearly 70% since pre-COVID levels, with meaningful room for recovery for the best portfolios as fundamentals continue to improve from trough levels over the last five years.
Figure 4: Office net absorption
Source: JLL Research, as of December 31, 2024.
Europe
The broad macro backdrop for U.K. and Europe should see modest GDP growth in most countries. Of the major economies, we expect the best growth to come from Spain and the worst from Germany with export-driven economies most negatively impacted by potential Trump tariffs. While the uncertain growth environment could present a risk for stagflation, this is not our base case for the coming year. Further, political risks remain top of mind across Europe again in 2025. France faces the risk associated with a barely functioning government in place until new elections can be called in June. If further spending cuts cannot be implemented, the country could receive another credit rating downgrade. Elsewhere in Germany, following a vote of no confidence, there will be elections in the first quarter of 2025, though the risk from a populist government being elected remains low. The U.K. will also face further budget uncertainties, but any significant decline in growth expectations would likely lead to more aggressive interest rate cuts.
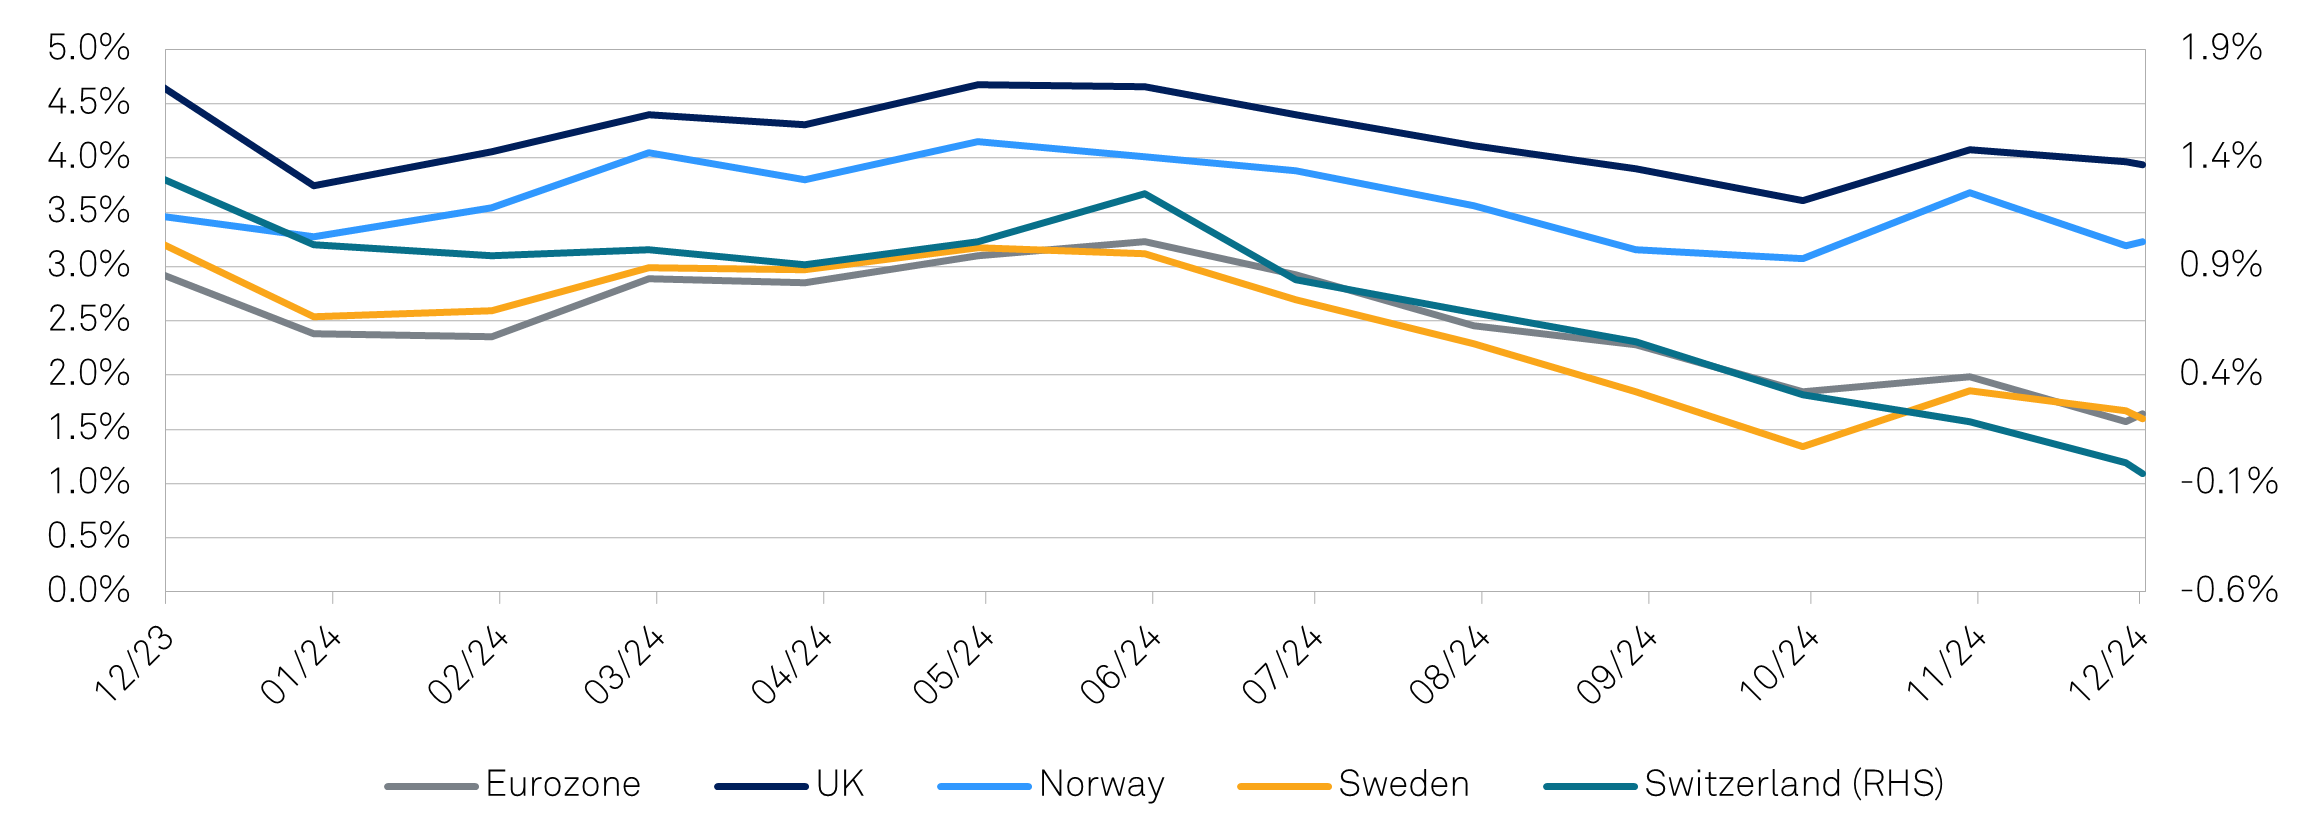
From a monetary policy perspective, we expect further policy rate cuts across the region (Figure 5), including a continuation of the cuts from the European Central Bank, which began in June 2024, and the Bank of England, which began in September 2024. Medium-term inflation expectations have decreased more in Sweden and the Eurozone than the U.K., driving our conviction for more policy rate cuts in Europe than the U.K. However, while credit spreads and swap rates have seen sizeable compression since the onset of rate cuts, they have recently started to rise and are likely to remain volatile. All in, it remains unlikely that near-term funding costs decline significantly, regardless of the trajectory of Central Bank interest rate expectations.
Figure 5: One year forward interest rate expectations are near the lowest since the beginning of the cutting cycle
Source: Bloomberg, as of December 31, 2024.
In this context, we are focused on the impact of interest rates on property valuations, balance sheet strength, and equity valuations in relation to our outlook for the REIT sector in this region. As it relates to the impact of interest rates on property yields, the decline in valuations is already behind us, which could lead to modest yield compression going forward. This is particularly the case in the U.K. in sectors such as shopping centers and student accommodation. However, we still see the biggest risks for continued value degradation across the office sector in the U.K. and Continental Europe. From a balance sheet perspective, with a few exceptions, leverage levels are now more manageable in Europe given the aforementioned valuation corrections. Further, we expect opportunistic equity raises in the coming year, rather than companies being forced to issue equity defensively. Lastly on equity valuations, multiples do not screen as expensive going into 2025, but we expect low single digit earnings growth in both the U.K. and Europe as higher financing costs still have a negative impact versus in-place debt, despite interest rate cuts. As such, we do not anticipate multiple expansion. In this environment, we prefer the lower leverage of the U.K. versus Europe and see higher relative growth opportunities such as the German residential and U.K. student accommodation sectors.
German Residential
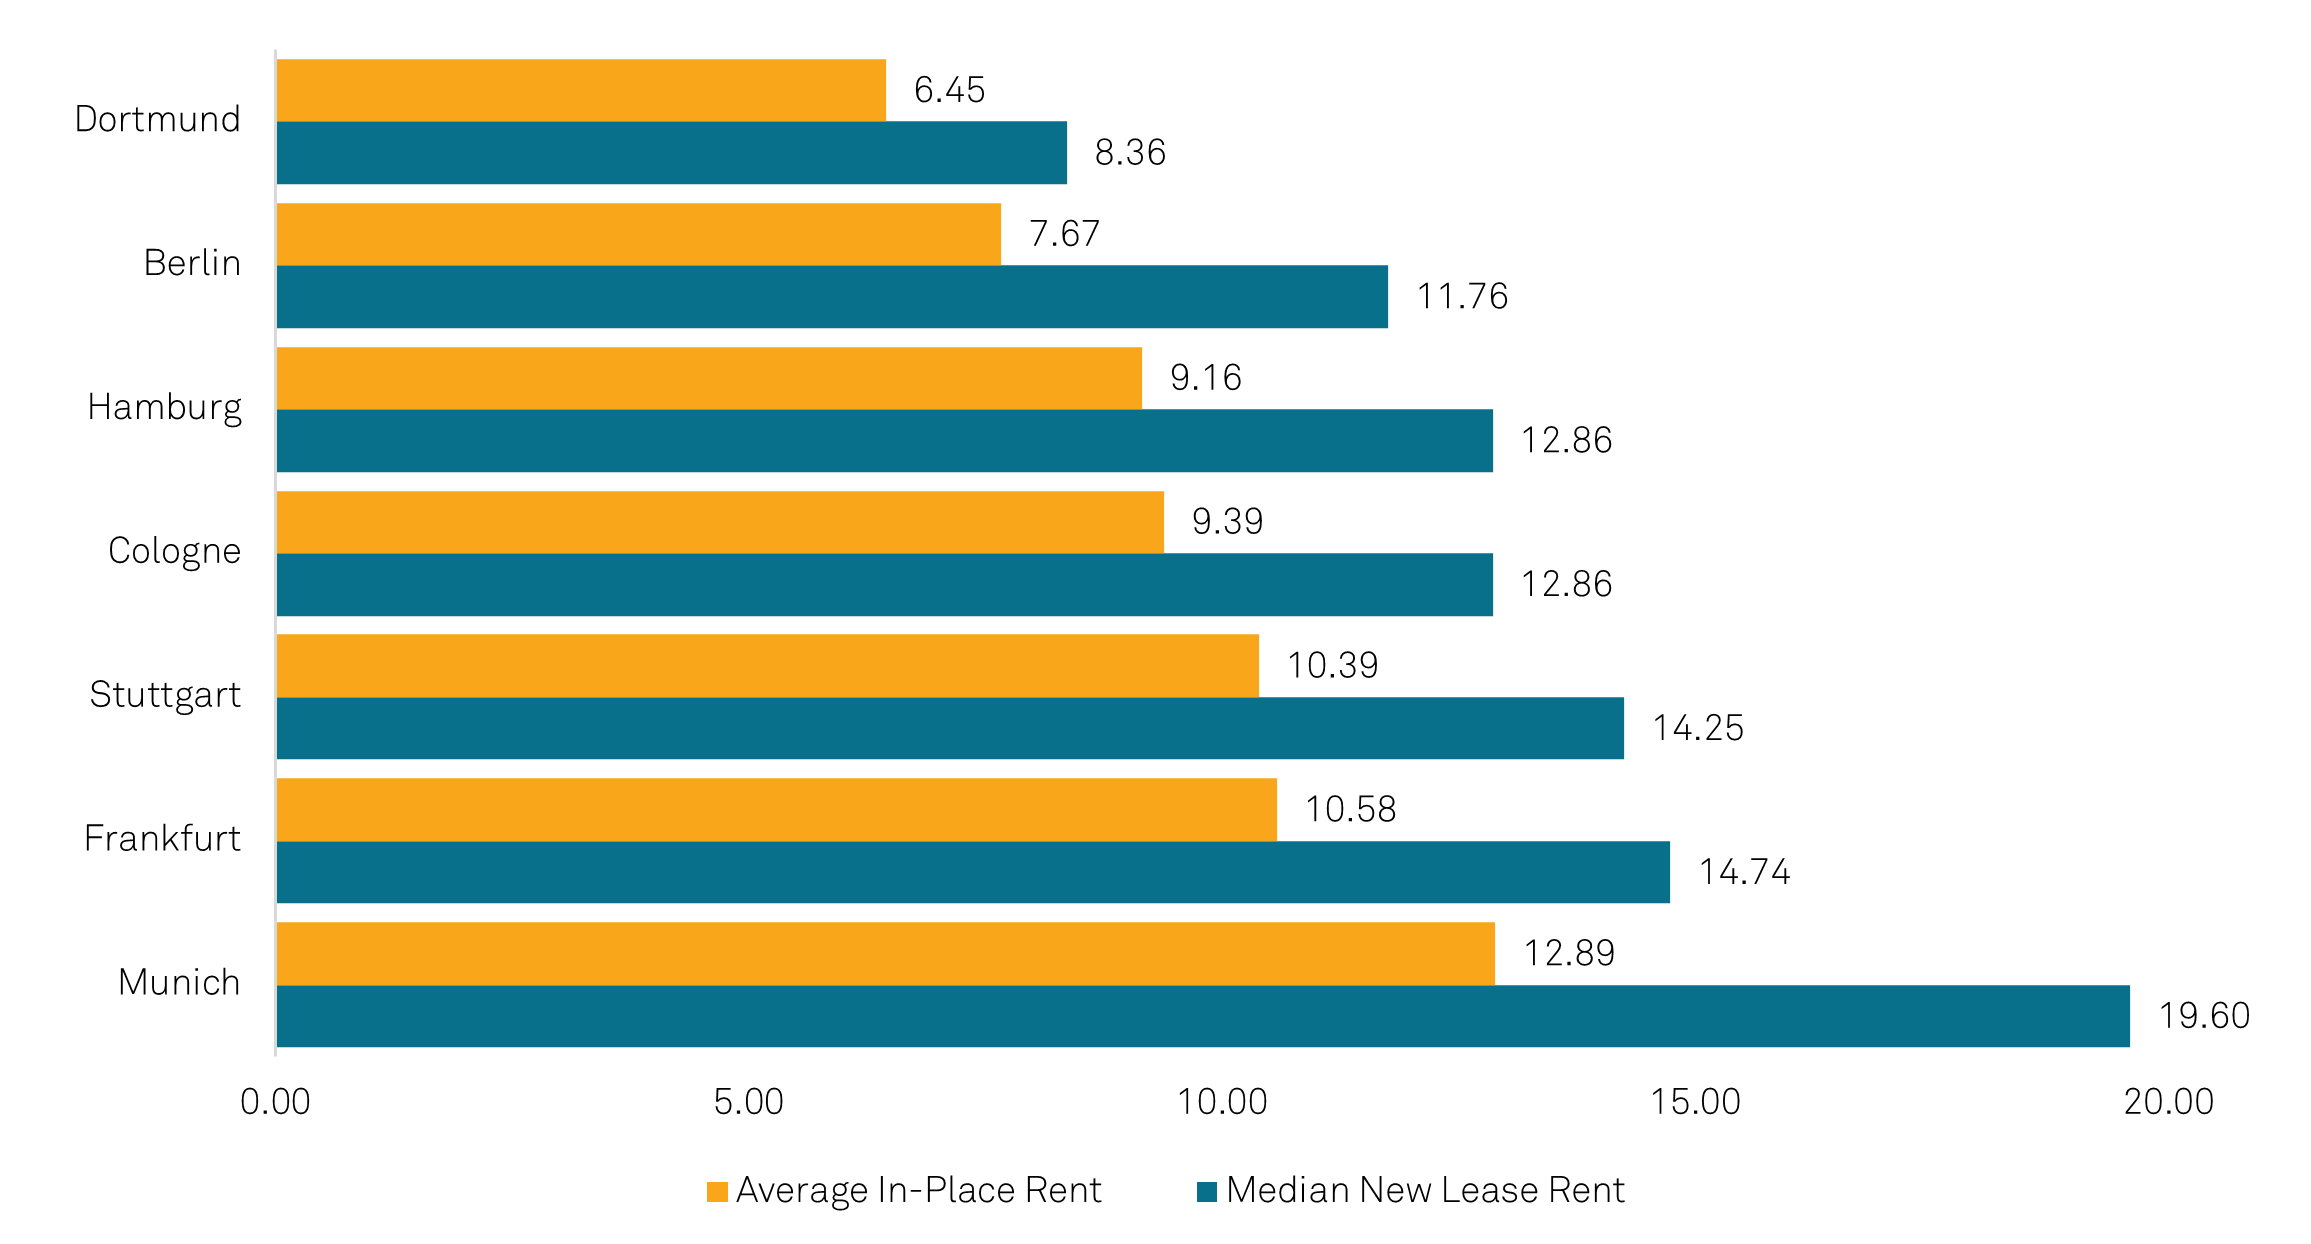
German residential should benefit from declining interest rates and remains attractive in a low-growth, low-inflation environment. Indications from both appraisers and the companies lead us to believe we are likely close to a trough in values. This reduces deleveraging requirements for the companies and opens the opportunity for more meaningful external growth as companies begin making acquisitions again in the coming year. The supply and demand imbalance remains very favorable, with new completions having averaged below 300,000 units annually for over ten years against a German government target of at least 400,000. This trend is set to continue as the number of new building permits for apartments continues to fall. When combined with rent caps in place, the sector should continue to grow rents regardless of the economic environment, as a significant rent mark-to-market exists in all regions of Germany (Figure 6). We anticipate 3.5% like-for-like rent growth over the medium-term, which looks attractive versus many sectors, such as office, where we expect further rent degradation. With the German economy likely to be one of the weakest in Europe over the next year, the growth prospects for the sector will continue to look relatively attractive versus alternatives given current valuation metrics.
Figure 6: In-place versus new lease rents in Germany
Source: CBRE, as of November 2024.
U.K. Student Accomodation
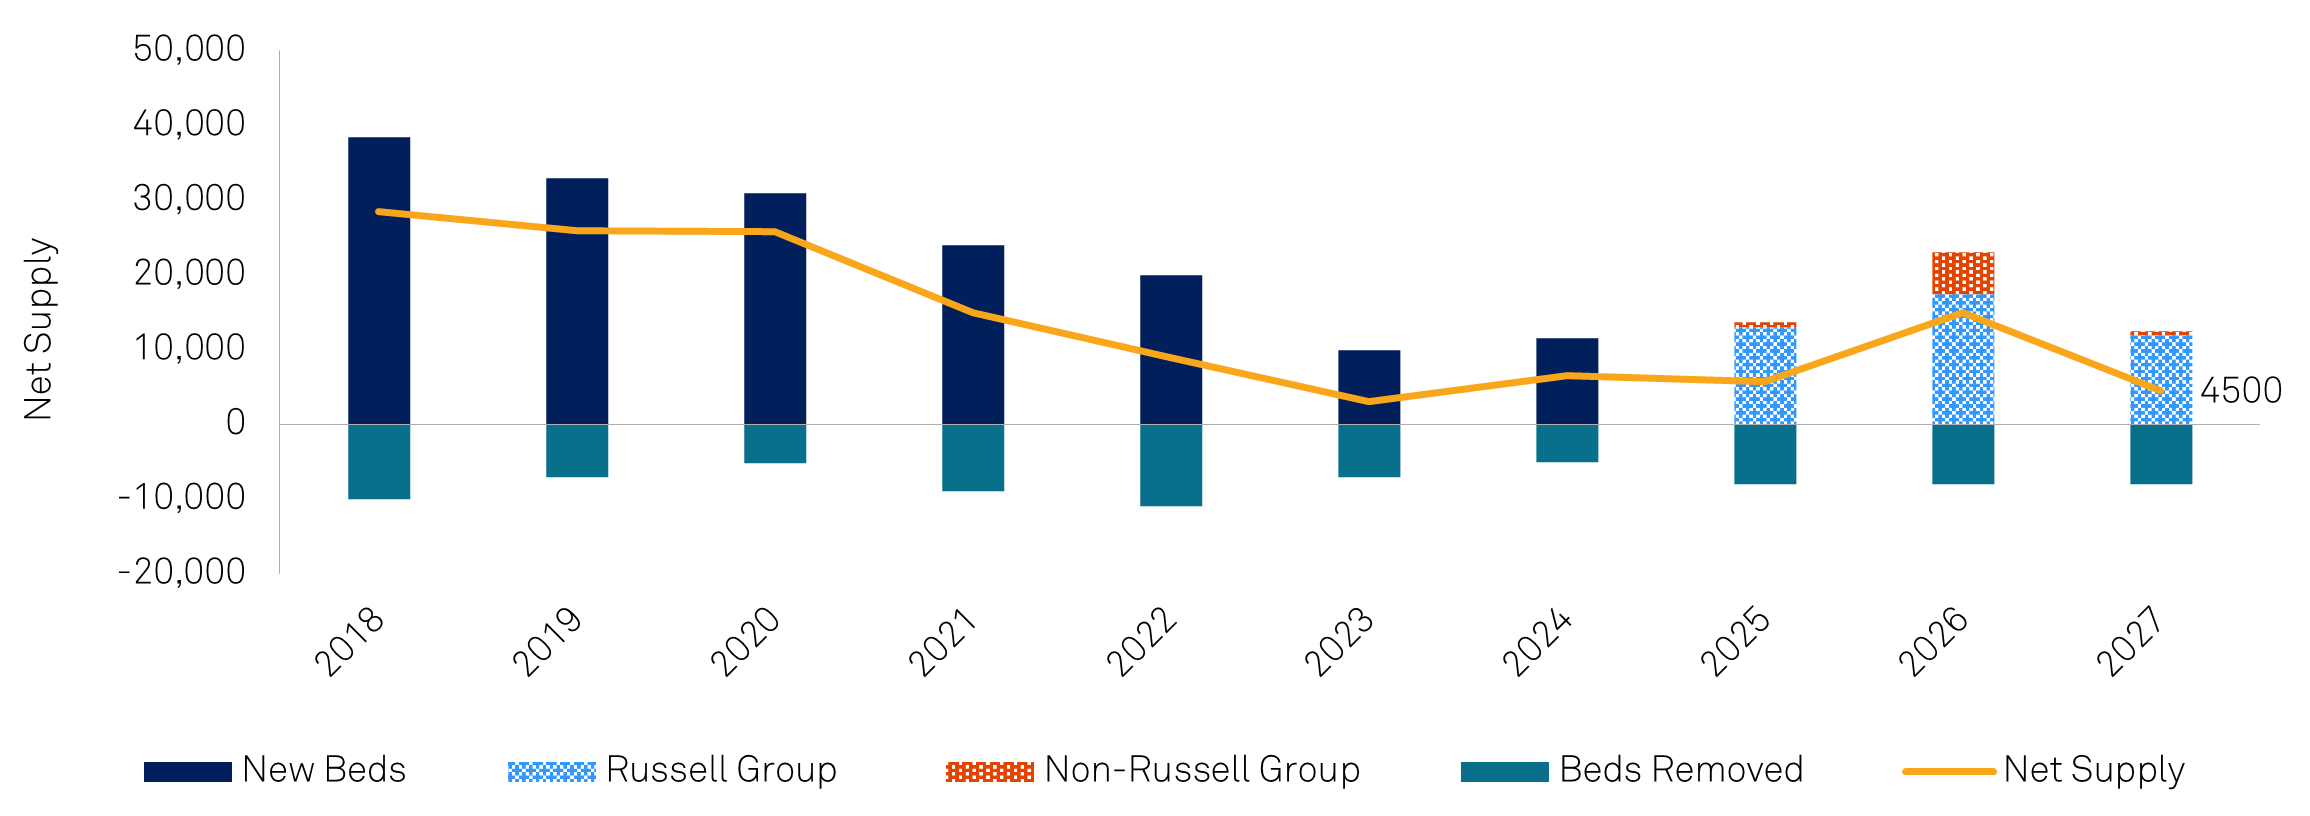
Despite the sector’s underperformance in 2024, both the occupier and investment markets for student accommodation remain strong. The population of 18-year-old students in the U.K. is set to increase over 10% in the next five years, and application rates continue to improve, particularly for the higher quality universities where the sector has the largest exposure. International applications have increasingly been driven from outside the EU, and concerns over visa restrictions for families of students have had no impact on the student accommodation REITs’ core market. Supply for the sector remains tight versus history as small landlords continue to exit the sector due to the increased taxation burden that does not affect the REITs (Figure 7). These units offer affordability versus alternative choices, especially when including other amenities provided and all utility costs. As such, while rent growth has been slowing, we expect growth in the medium-term to be above inflation in the mid-single digits. Leverage remains under control for the sector and recent equity raises provide the capital to fund value-accretive developments in the coming year.
Figure 7: Net supply change of purpose-built student accommodation beds
Source: CBRE, Cushman & Wakefield, Unite, as of November 2024.
Asia Pacific
The two Asian markets to watch in 2025 will be China and Japan for widely different reasons.
China will focus on stabilizing headline growth likely in the 4.5% to 5.0% range, which could be a challenging proposition considering potential trade tariffs by the U.S. and other trading partners, and the continued weakness in its residential market, once a key driver of growth. Housing investment is unlikely to recover strongly in 2025, but the most recent monetary and fiscal easing measures have led to a noticeable improvement in housing transactions. Improving transaction volumes should in time translate into stabilizing land purchases, which are important as land sales are a key funding source for local governments, and construction values, which flow directly into GDP. While a sharp recovery in the housing market is unlikely, 2025 should see the sector trough and its negative spillover effects into household balance sheets, private consumption, and headline growth, mediate. That would constitute a win for Beijing and would be positive for Chinese and Hong Kong equities, particularly in the real estate sector.
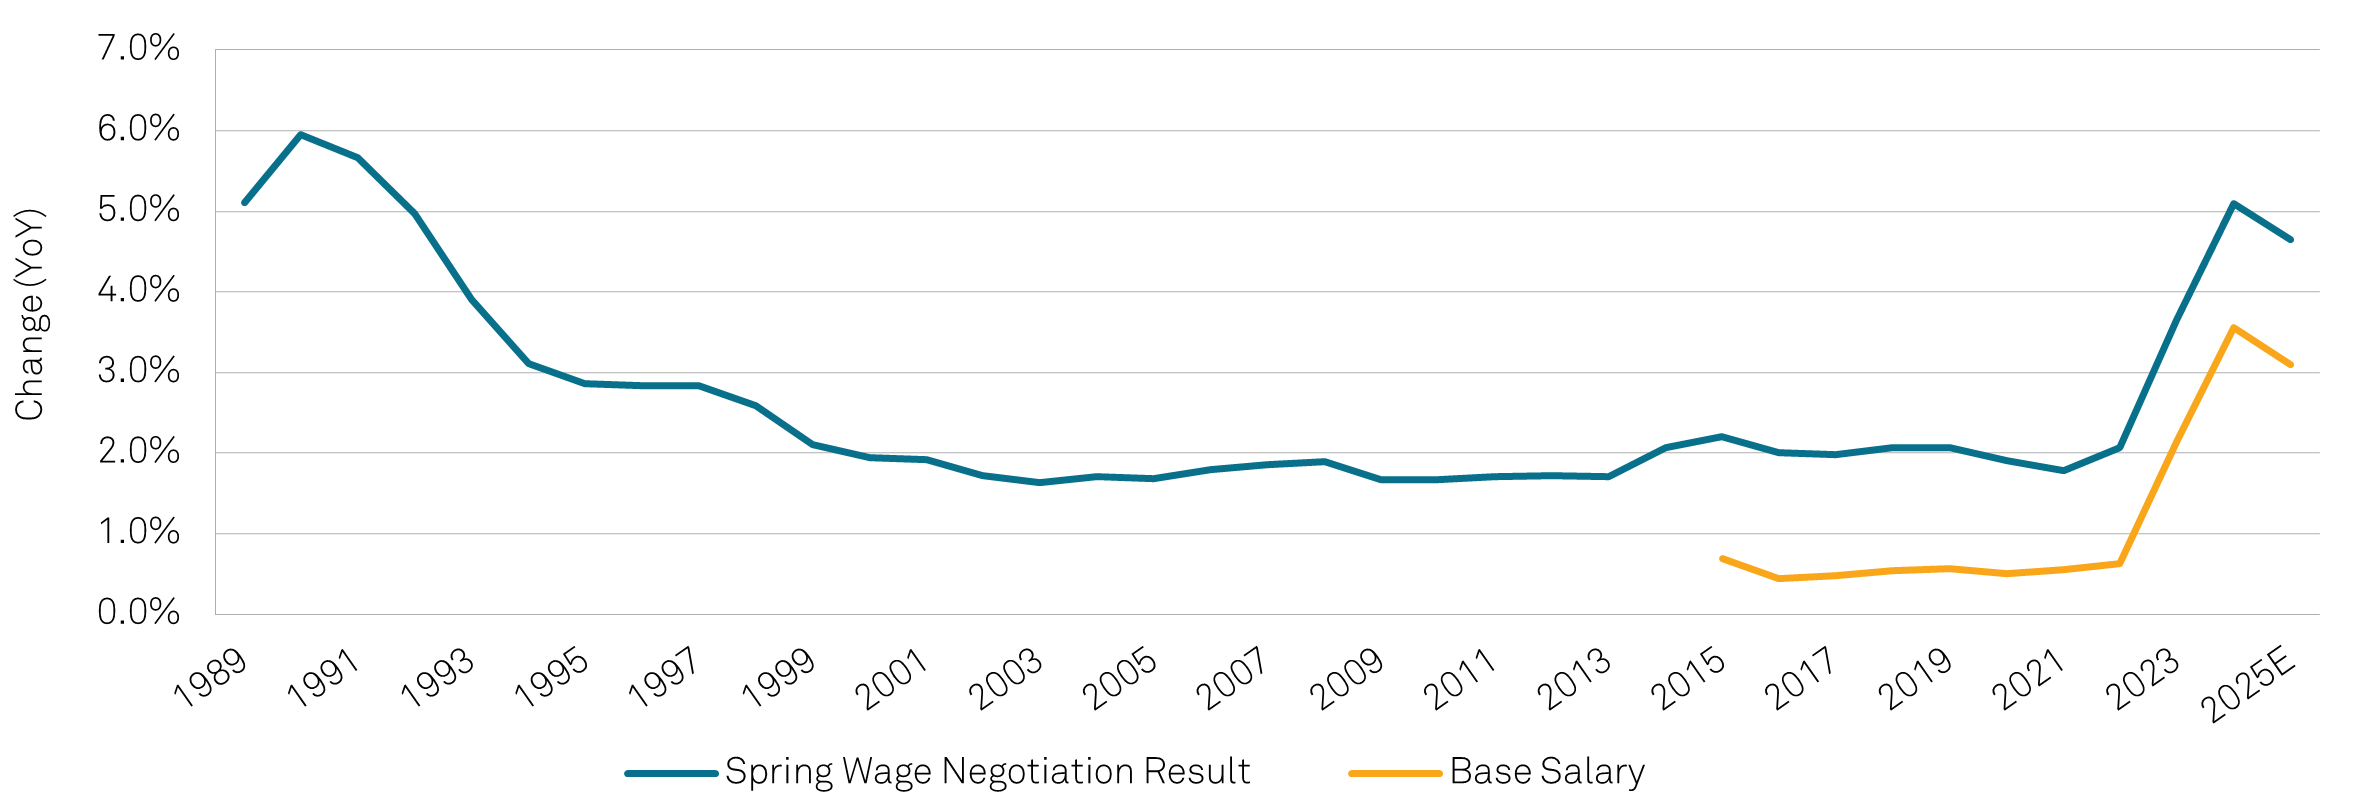
Japan stands at the other end of the economic scale with the promise of permanently breaking out of its decades-long economic stagnation. In 2024, wage growth rose to levels last seen in the early ‘90s and real wage growth turned positive for the first time since 2021 (Figure 8), raising hopes that domestic consumption could become the economic growth engine that it has not been for many years. Much will depend on the spring wage negotiations, or Shunto, that take place in March, which will be key in determining the trajectory for wages, disposable incomes, and consumption.
Figure 8: Japanese wage growth
Source: Nomura, Kaidanren, as of November 2024.
Less well known, but almost as important to Japan’s newfound promise of economic dynamism, are the structural reforms taking place across corporate Japan. The ongoing takeover battle between private equity (PE) heavyweights Bain and KKR for Fuji Soft is only the most recent and visible symbol of a flurry of PE activity, with Japan ending 2024 as second only to the U.S. in private equity dealmaking. M&A guidelines were updated to improve corporate transparency and encourage consolidation, as seen by the recent merger plans between Honda and Nissan. Large cross-shareholdings, poison pills, and a generally weak focus on shareholder returns offer plenty of low-hanging fruit for Japanese corporates to pluck and come with the potential for new economic vigour and outsized share price gains in 2025.
Beyond the dynamics at play in China and Japan, the policy and economic environments remain varied across all individual markets in the region. Across the disparate backdrop of monetary policy, growth, and real estate fundamentals in the region, we have highest conviction on opportunities available in the REITs within the Japanese multifamily and Sydney office sectors.
Japan Multifamily
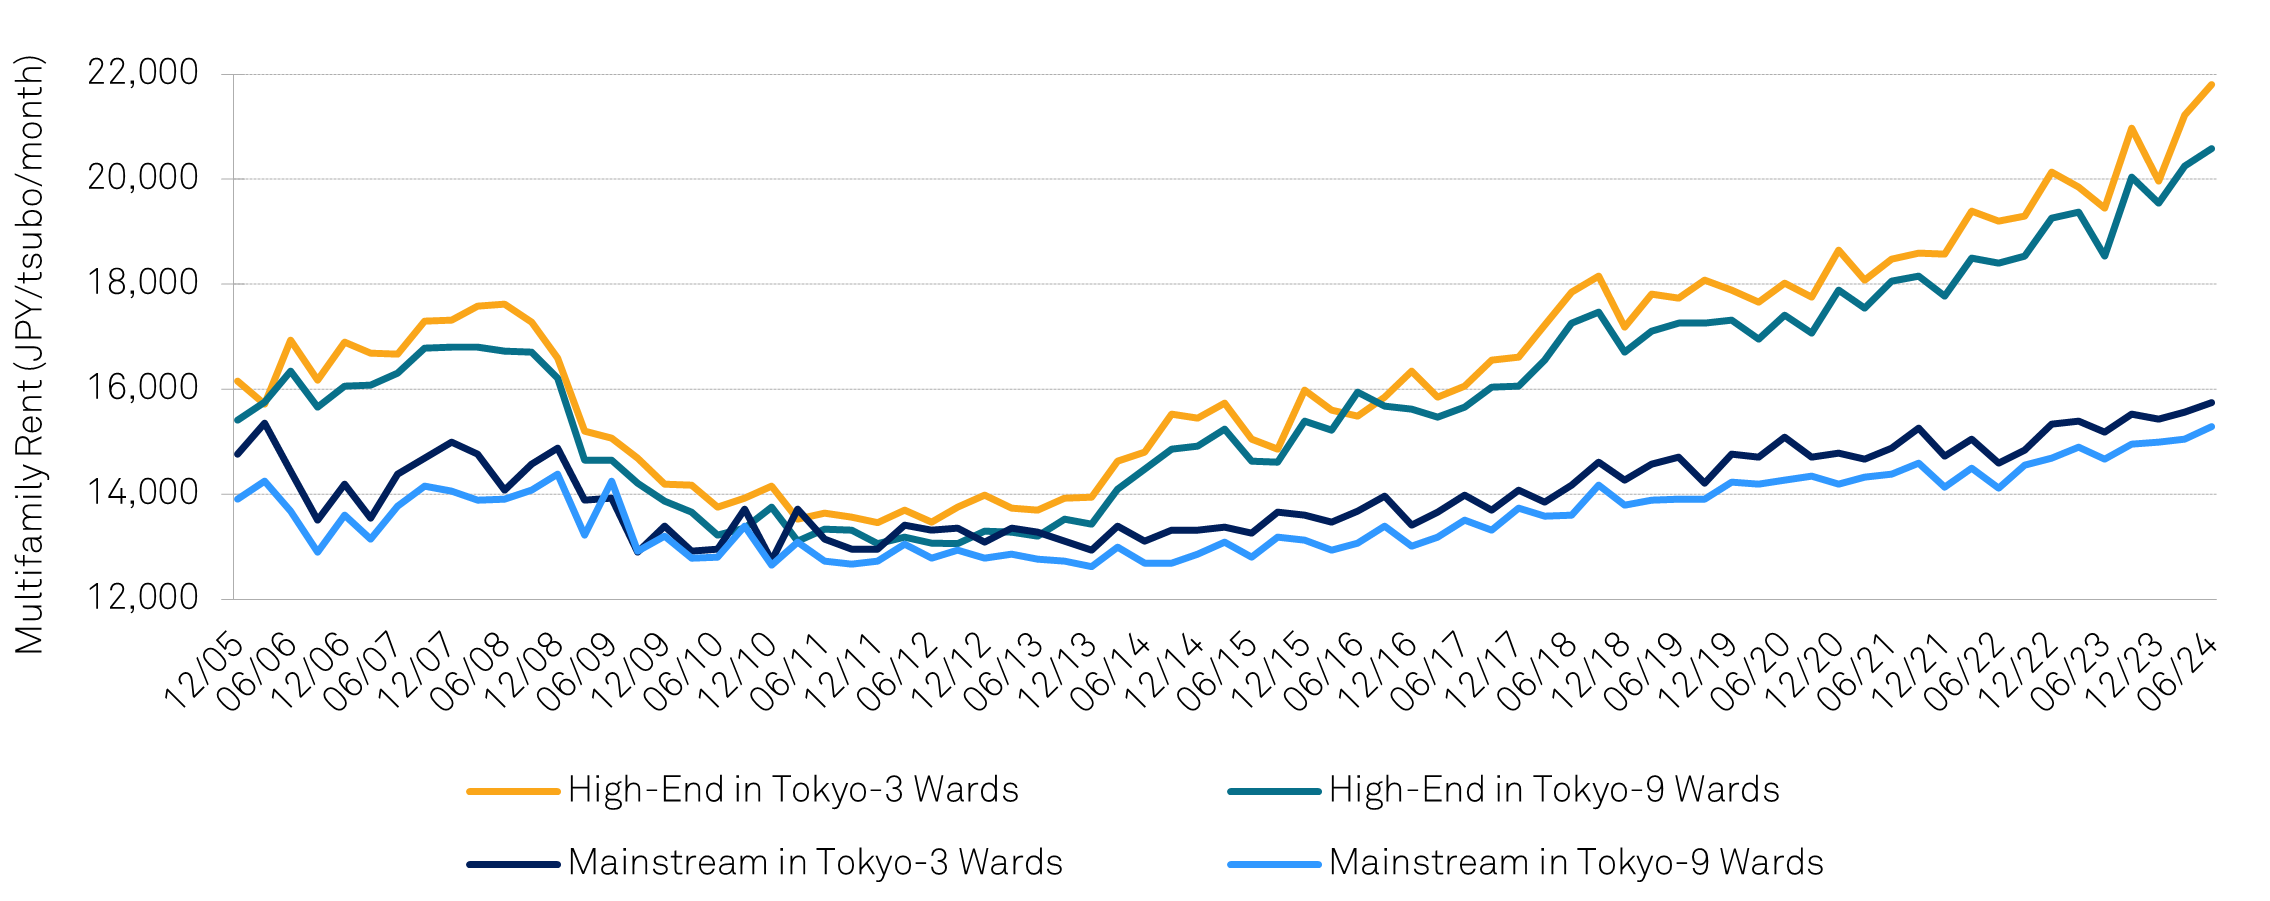
Multifamily accommodation is poised to perform well in a higher inflationary environment in Japan thanks to its lease contract structure and supply-demand imbalance in cities like Tokyo. Rental accommodation leases are generally signed for two years, providing timely opportunities for rent increases. This is particularly the case for REITs with large multifamily portfolios, as approximately a quarter of leases turn over every six months, giving REITs the ability to adjust portfolio rents to market quickly. From the first half of 2020 to the first half of 2024, rents across Tokyo’s nine wards rose by 7.1%. For high-end units, of which the REITs own a disproportionate amount, rents rose by a staggering 18.1% over the same time (Figure 9). The rise in rents is a function of inflation and tight supply. While Tokyo’s population continues to grow, multifamily completions are stagnating. Furthermore, renters, who would historically have bought their own units, are increasingly shut out of the condo market since condo prices have risen sharply on higher construction costs and falling supply. Additionally, rental accommodation REITs routinely operate with occupancies in the high 90% range, giving them additional pricing power. While Japanese REITs are traditionally focused on maintaining mutually beneficial relations with their tenants and are unlikely to raise rents as aggressively as landlords in other countries, if inflation and wage growth remain above their historical averages in 2025, multifamily rents should continue to grow faster than historical levels.
Figure 9: Tokyo multifamily rents
Source: Ken Real Estate Investment Advisors, SMBC Nikko, as of Q2 2024.
Sydney Office
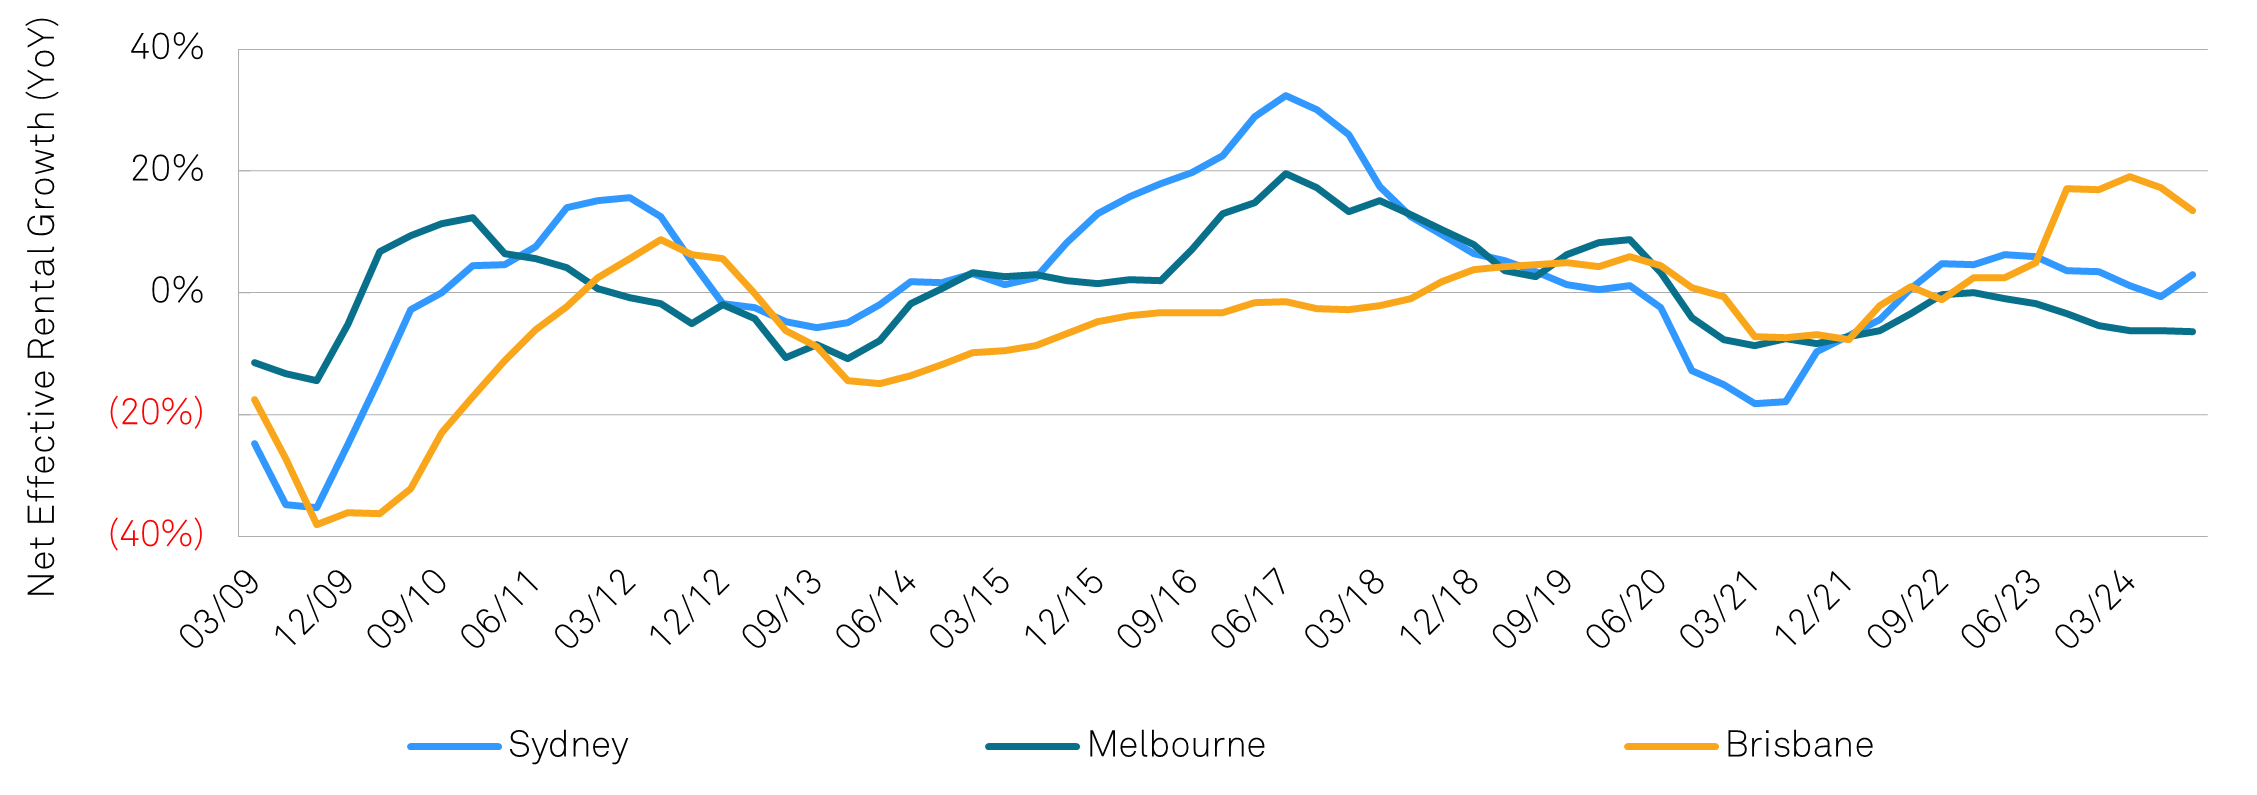
Headline figures for Sydney’s office market continued to paint a sobering picture in 2024, with vacancy of 14.7%, net effective rents 10.5% below their 2020 peak, and capital values down 21% from their 2022 highs. When looking at the most recent trend, however, we believe the second derivative across most key metrics has turned positive and will remain so as new supply is dwindling in a city that continues to grow and is seeing large corporate tenants come back to the market in search of high-quality office space. Net effective rents rose 3.0% year-on-year driven by 77,000 square meters of net absorption in the first nine months of 2024 (Figure 10) and vacancy edged down by 0.7% to 14.7%. Looking forward, new deliveries for 2025 are expected to total 108,000 square meters, though 71% of that space has already been pre-committed, and a similar dynamic is expected through 2027. As construction costs rise and regulatory and energy requirements grow, supply is likely to undershoot demand for a prolonged period. With office landlords trading at large discounts to net asset values on both spot and historical bases, listed office REITs offer a compelling long-term investment opportunity.
Figure 10: Sydney net effective office rents
Source: JLL, as of November 2024.
Although much of the broader investment landscape seems uncertain, opportunity exists in pockets around the world for global REIT investors. From senior housing and office in the U.S., to German residential, U.K. student housing, multifamily in Japan, and office in Sydney there are potential winners amidst the volatility inherent in the current global macroeconomic context.
“Volatility may define the market, but opportunity defines the strategy—where will you find value in 2025?”
General Disclosures
Any statement of opinion constitutes only the current opinion of CenterSquare and its employees, which are subject to change and which CenterSquare does not undertake to update.
Material in this publication is for general information only and is not intended to provide specific investment advice or recommendations for any purchase or sale of any specific security or commodity. Due to, among other things, the volatile nature of the markets and the investment areas discussed herein, investments may only be suitable for certain investors. Parties should independently investigate any investment area or manager, and should consult with qualified investment, legal, and tax professionals before making any investment. Some information contained herein has been obtained from third party sources and has not been independently verified by CenterSquare Investment Management LLC (“CenterSquare”). CenterSquare makes no representations as to the accuracy or the completeness of any of the information herein. Accordingly, this material is not to be reproduced in whole or in part or used for any other purpose. Investment products (other than deposit products) referenced in this material are not insured by the FDIC (or any other state or federal agency), are not deposits of or guaranteed by CenterSquare, and are subject to investment risk, including the loss of principal amount invested.
For marketing purposes only. Any statements and opinions expressed are as at the date of publication, are subject to change as economic and market conditions dictate, and do not necessarily represent the views of CenterSquare or any of its affiliates. The information has been provided as a general market commentary only and does not constitute legal, tax, accounting, other professional counsel or investment advice, is not predictive of future performance, and should not be construed as an offer to sell or a solicitation to buy any security or make an offer where otherwise unlawful. The information has been provided without taking into account the investment objective, financial situation or needs of any particular person. Any indication of past performance is not a guide to future performance. The value of investments can fall as well as rise, so investors may get back less than originally invested.
Because the investment strategies concentrate their assets in the real estate industry, an investment is closely linked to the performance of the real estate markets. Investing in the equity securities of real estate companies entails certain risks and uncertainties. These companies experience the risks of investing in real estate directly. Real estate is a cyclical business, highly sensitive to general and local economic developments and characterized by intense competition and periodic overbuilding. Real estate income and values may also be greatly affected by demographic trends, such as population shifts or changing tastes and values. Companies in the real estate industry may be adversely affected by environmental conditions. Government actions, such as tax increases, zoning law changes or environmental regulations, may also have a major impact on real estate. Changing interest rates and credit quality requirements will also affect the cash flow of real estate companies and their ability to meet capital needs.
Definition of Indices
FTSE Nareit All Equity REITs Index “FNER”
The FTSE Nareit All Equity REITs Index is a free-float adjusted, market capitalization-weighted index of U.S. equity REITs. Constituents of the index include all tax-qualified REITs with more than 50 percent of total assets in qualifying real estate assets other than mortgages secured by real property.
S&P 500
The S&P 500 is an equity index made up of 500 of the largest companies traded on either the NYSE, Nasdaq, or CBOE. 2. The S&P 500 is calculated by adding each company’s float-adjusted market capitalization.
CenterSquare REIT Cap Rate Perspective Methodology
CenterSquare REIT Implied Cap Rates are based on a proprietary calculation that divides a company’s reporting net operating income (“NOI”) adjusted for non-recurring items by the value of its equity and debt less the value of non-income producing assets. The figures above are based on Q4 2024 earnings reported in September 2024.
The universe of stocks used to aggregate the data presented is based on CenterSquare’s coverage universe of approximately 200 U.S. listed real estate companies. Sector cap rates are market cap weighted. Sectors and market classifications are defined by the following:
Apartment: REITs that own and manage multifamily residential rental properties; Industrial: REITs that own and manage industrial facilities (i.e. warehouses, distribution centers); Office – REITs that own and manage commercial office properties; Retail – REITs that own and manage retail properties (i.e. malls, shopping centers); Hotel – REITs that own and manage lodging properties; Healthcare – REITs that own properties used by healthcare service tenants (i.e. hospitals, medical office buildings); Gateway – REITs with portfolios primarily in the Boston, Chicago, LA, NYC, SF, and DC markets; Non-Gateway – REITs without a presence in the gateway markets.
The REIT ODCE Proxy is a universe of REIT stocks built to resemble the NCREIF Fund Index – Open End Diversified Core Equity (ODCE). The ODCE, short for NCREIF Fund Index - Open End Diversified Core Equity, is the first of the NCREIF Fund Database products and is an index of investment returns reporting on both a historical and current basis the results of 36 open-end commingled funds pursuing a core investment strategy, some of which have performance histories dating back to the 1970s. The REIT ODCE Proxy is proprietary to CenterSquare and uses gateway/infill names in apartments, retail, industrial and office, and then weights them according to the ODCE index to create a proxy.
Private Market Cap Rates represent the cap rate achievable in the private market for the property portfolio owned by each company and are based on estimates produced by CenterSquare’s investment team informed by various market sources including broker estimates.
These benchmarks are broad-based indices which are used for illustrative purposes only. The investment activities and performance of an actual portfolio may be considerably more volatile than these indices and may have material differences from the performance of any of this index. A direct investment in an index is not possible.
FTSE Data disclosure: Source: FTSE International Limited (“FTSE”) © FTSE 2025. FTSE® is a trade mark of the London Stock Exchange Group companies and is used by FTSE under licence. All rights in the FTSE indices and / or FTSE ratings vest in FTSE and/or its licensors. Neither FTSE nor its licensors accept any liability for any errors or omissions in the FTSE indices and/ or FTSE ratings or underlying data. No further distribution of FTSE Data is permitted without FTSE’s express written consent.
